How to easily track OKRs in Excel using Supermetrics
In this article we will guide you through the process of tracking your Objectives and Key Results in a simple and straightforward way using Excel and Supermetrics. We created an OKR Excel template for you and we will explain step by step how to use it and customize it according to your individual needs so that you can really take your OKR tracking to the next level with Supermetrics!
Do you prefer Google Sheets over Microsoft Excel? Not a problem. We also provided a walkthrough on how to set up your OKR Tracking using Google Sheets – because the devil is usually in the details. Just follow the link to our article on how to set up your OKR Template for Google Sheets with a matching editable template. And if you still have doubts about why you should use OKRs in the first place, the linked article provides detailed background information to guide you in making that decision. Are you already convinced? Are you an Excel user? Then you are in the right place.
Table of Contents
I. Why use OKRs? And how do you track them?
We want to quickly delve into the world of OKRs (Objectives and Key Results) and Supermetrics, before we dive into the actual process. In short, OKRs are basically a goal setting framework used by organisations, teams and individuals to define measurable goals and track their outcomes.
They are used by many teams to put their company goals in an actionable framework that interlinks the sub-goals of each department or team. OKRs are known for helping organizations and teams improve performance and employee satisfaction. The framework also fosters teamwork – each team member contributes to how every goal is achieved while improving their leadership skills in their role as DRIs (Directly Responsible Individuals).
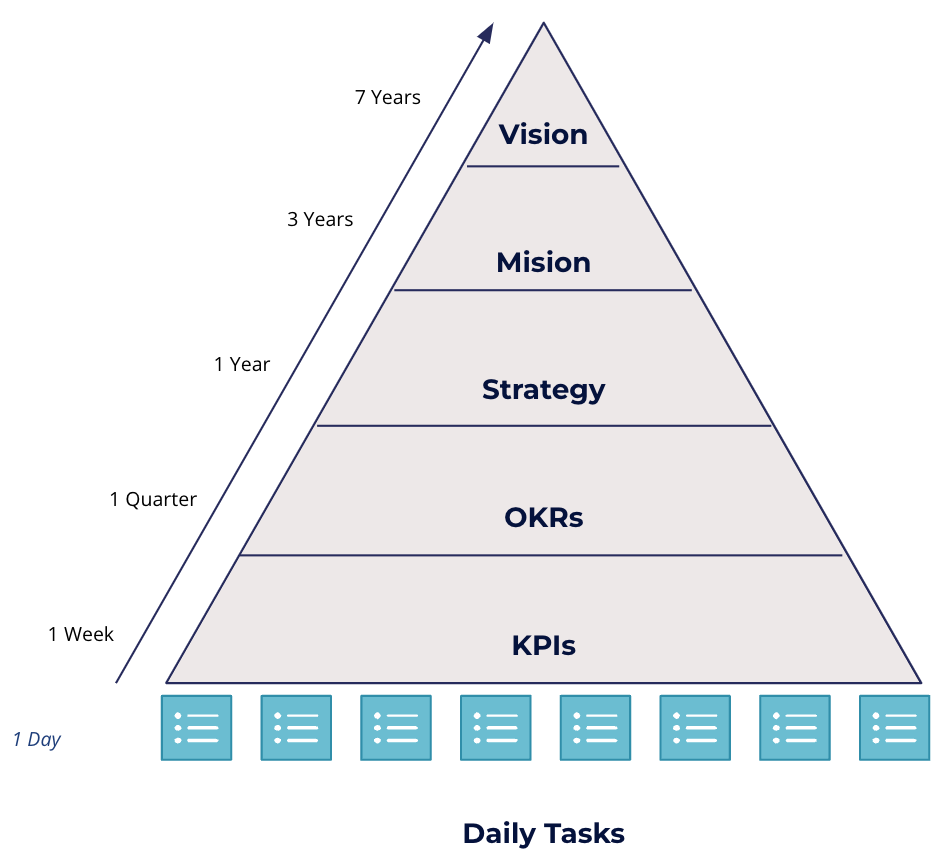
We at Kemb for example have been using OKRs since 2014. We implemented an automated and effective framework that helps us track our quarterly-defined OKRs on a weekly basis using Supermetrics queries – and so you can with the help of our excel template.
Supermetrics is a data integrator/connector that streamlines data delivery from 80+ sales and marketing platforms into various analytics and reporting tools. Basically, you can build an automated process with Supermetrics queries and stop wasting time on copying and pasting data.
So much for the background, now let’s get down to business and start working out your OKR Excel template.
Set up your framework – Preliminations
Working smartly and automating your processes go together especially when it comes to data and reports. Hence, we highly recommend that you set up an automated process to track your OKRs from the get-go. Supermetrics comes in handy in this case as it allows you to connect to almost all your data sources with just a few clicks in excel. To get you started, we recommend the following steps.
1.1 Set S.M.A.R.T. Goals
Setting SMART (Specific, Measurable, Achievable, Realistic, and Timely) objectives and goals probably is the most important but also a very demanding task. Measurability is particularly important when it comes to automation. So take the time to select, question, and finally define appropriate goals as precisely as possible. In our experience, automating OKRs challenges you in making sure your goals are easily measurable.
An example might be: “Acquire 500 organic website visits this quarter.”
1.2 Where to get your data from?
Defining the actual metrics you need in order to track your OKRs is the first big step. Once this is done, you should think of how and where to source the required data.
What is great with Supermetrics queries is that you can import data from different sources with just a few clicks. In the link you can find a list with all available Supermetrics Connectors.
An example might be: sourcing organic website visits data from Google Analytics through Supermetrics.
1.3 Getting your data to Excel using Supermetrics queries
Once you know what data needs to be collected, the exciting part can start – bringing in the data into one excel file that will serve as your main OKR dashboard. We highly suggest you use a separate tab for data import in our OKR Excel template. You will find a “Weekly Import” tab in our template which you can use to store all your raw data extracts. We also recommend using the date range “year to date” and to split the data by “year & week (Mon–Sun)”. Section 2 provides further explanation.
1.4 Matching your data
After you have successfully imported the data, you need to match the data in the “Weekly Import” tab to the key results in the OKRs dashboard. You can find a detailed explanation on how to do this in section 2.
1.5 Set-up automated periodic refreshes
Once you are certain that your data import queries ran correctly, you can easily set-up weekly refreshes to update your metrics. You can also decide to automatically send weekly update emails to your team-members to create more visibility and keep everyone on track.
A Process worth going through
Automating your OKR refreshes helps you in a lot of ways. Just to give you a few examples:
- You will create more awareness and a better understanding of both team and personal OKRs. Through visibility and involvement, you encourage collaboration throughout your company. People get a better understanding of their colleagues day to day work and how everyone contributes to a shared vision
- You will significantly reduce the risk for potential copy & paste errors when manually editing the data
- This will also lead to significant time savings, as Supermetrics automatically updates all the relevant data for you
- One last practical benefit is of course to solve the problem of weekly meetings with missing numbers.
Now that we are all caught up on what OKRs are, how they can benefit your team and how to automatically refresh your dashboard using Supermetrics queries, let’s delve deeper into how to set-up your goals tracking. They can be implemented and tracked on three levels:
- Company OKRs for overall company goals
- Team OKRs to track a subset of objectives that are department-specific and which feed into the overall company OKRs
- Personal OKRs to empower employees achieve self-development and career goals.
Our excel template was built on these levels. We use the same dashboard for company and team OKRs and a separate dashboard for personal OKRs.
In the next section, we will give you a quick run-through on how to set-up the “Company|Team OKRs” dashboard. These steps can then later be replicated for further OKRs dashboards.
Make our OKR Excel Template your own – Step by Step
To get started, you only need three things: an excel account, our template and a Supermetrics plan that offers the connectors you need to set-up your account. We will now take you through the implementation step by step:
Step 1: Download our OKR Excel Template HERE
Once you downloaded and opened the file, the next thing you want to do is to duplicate and rename the tabs just the way you need them to be named.
Next, you need to define the tracking period by imputing the first day and last day of the quarter on the first dashboard (it will automatically update on the remaining dashboards)
Note: Only edit cells highlighted yellow (in the light theme tabs) or blue (in the dark theme tabs).
Step 2: Connecting Supermetrics with your Excel-Account
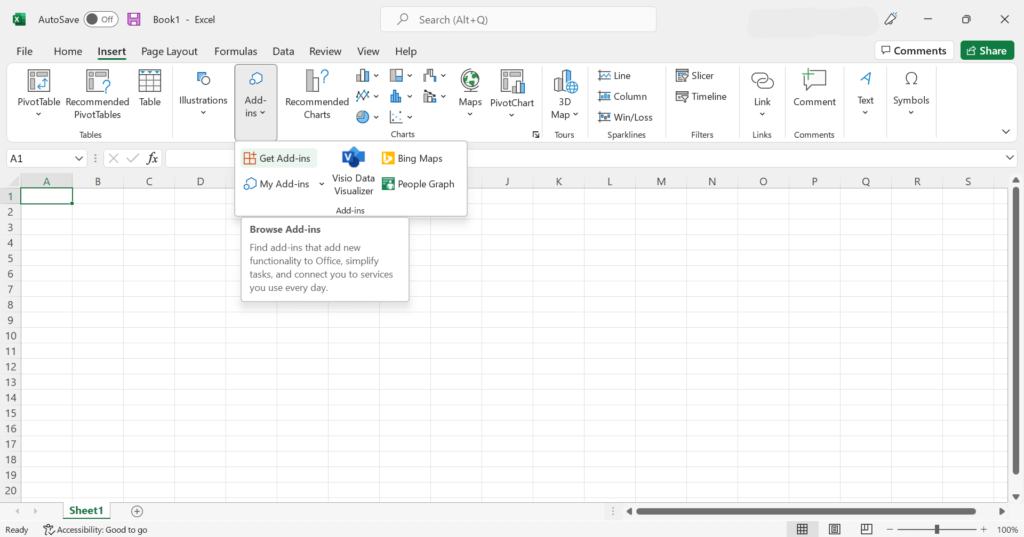
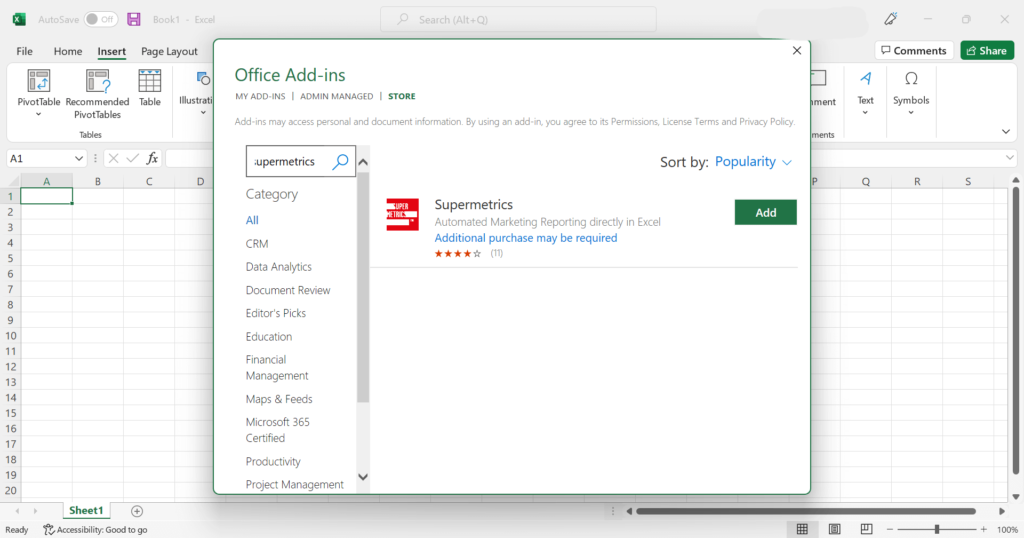
You already did the first personalizations on your template and set up your Supermetrics plan? Great, you can now add the Supermetrics add-in directly in Excel by navigating to Insert >> Add-ins >> Get Add-ins >> Office Add-ins and enter “Supermetrics” in the search tab and follow subsequent steps.
At kemb, we often connect to our marketing performance data from Google Analytics, Google Ads, Linkedin Ads, Facebook ads through Supermetrics in order to track key results such as:
- Grow Organic Website visits from X to Y in Q1
- Increase Conversion Rate from LinkedIn Campaigns by 10% from 2.5 to 2.75 in Q1
- Double the Leads from partner webinars from 20 to 40 in Q1
You can find a longer list of OKR examples split by departments here. We created this list to suggest ideas and angles on how to track Objective and Key Results per Department. Please, feel free to share your suggestions in the comment section and we will add them to the table.
Step 3: Setting your Objectives & Key Results
As mentioned above, it is important to set SMART goals, especially measurable goals. This will help you easily define the objectives and key results to track on your OKRs dashboard.
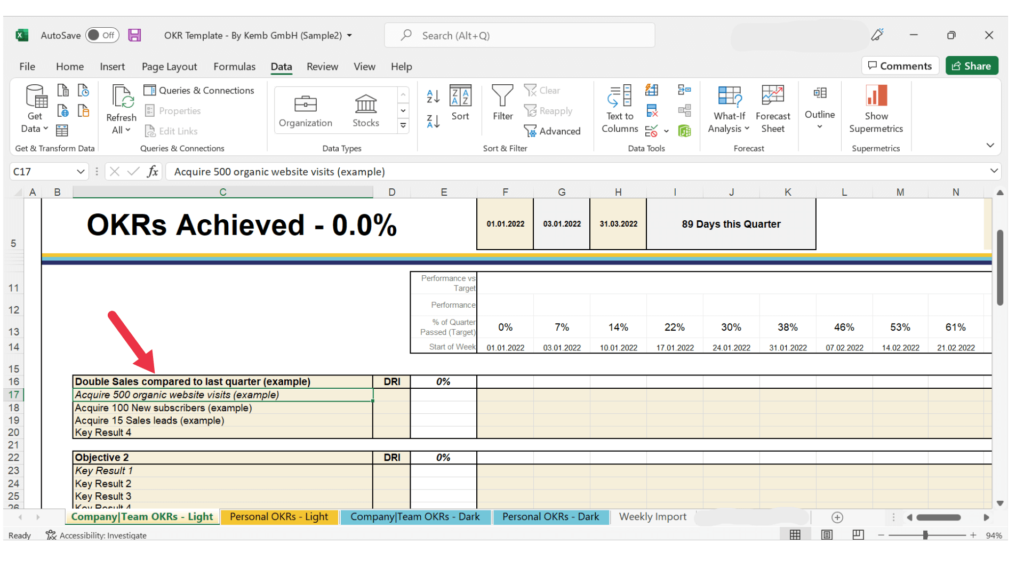
Key results are the elements (sub-goals) that make up your objective (main goal). For example, the sales/marketing team can set an objective to “Double sales compared to last quarter (Q4 2021)”. To achieve this, they would ideally hold a brainstorming session and likely come up with key results like, “Acquire 500 organic website visits”, “Acquire 100 New subscribers” or “Acquire 15 Sales leads”. These objective and key results should be listed in column C in the OKR dashboards.
Step 4: Fetching the data
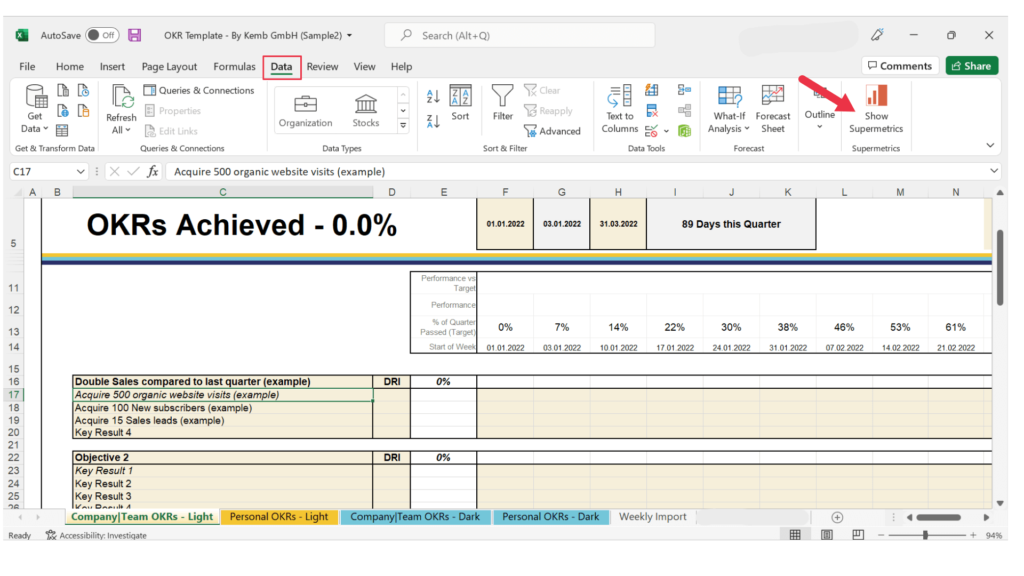
Once you have the Supermetrics Add-on installed (as described above), you can launch the Supermetrics sidebar by navigating to Data >> Show Supermetrics:
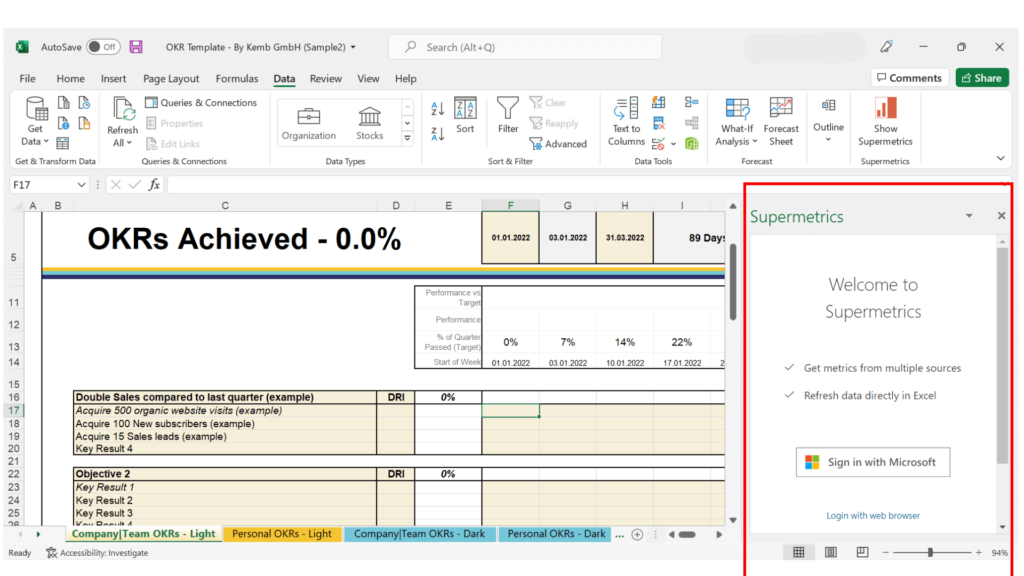
The sidebar would look like this:
Now that the sidebar is visible, follow these steps:
1. Navigate to the “Weekly Import” tab in your Excel Sheet
2. Click on cell C11 for the first query
3. Navigate back to the sidebar and start filling out the required information for the first query. Based on our example, that would be the query to pull in the weekly organic website visits for Q1 2022 (for our sample query we select the following elements):
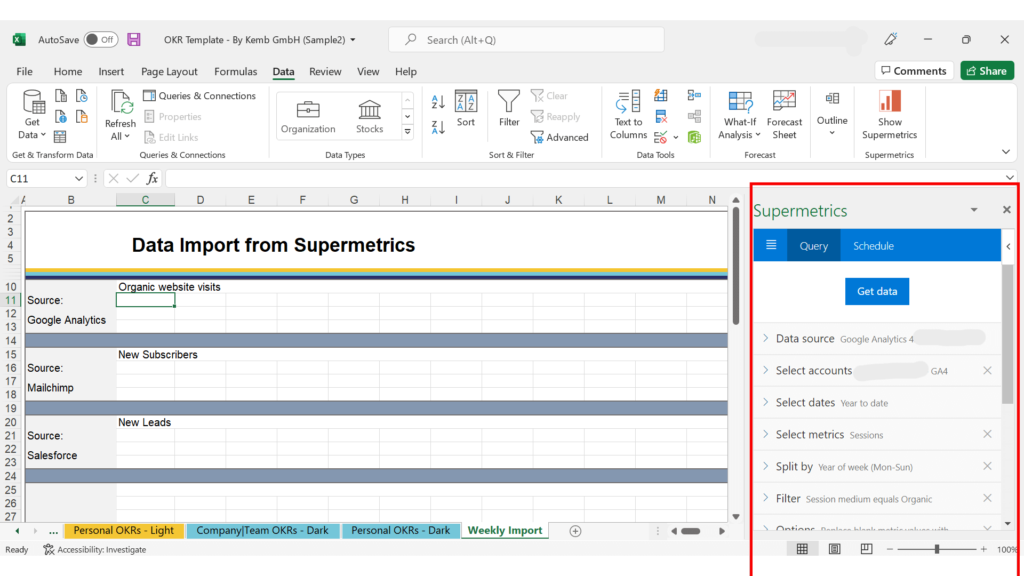
| Data source | Google Analytics (or any other data source) |
| Select accounts | Select the account/view where the data for the key result can be found |
| Select dates | Select year to date since the OKR template we created is for a quarter (Supermetrics does not currently have a “Quarter-to-Date” feature). Alternatively, you can use other date settings; however, you would have to Index/Match your weeks to the dates in the OKR dashboards |
| Select metrics | Sessions (or any other metrics you need based on the key results you defined |
| Split by | Year & Week (Mon-Sun) |
| Filter | Use filters to narrow down your data e.g Medium = Organic |
| Options | Select “Replace blank metric values with zeros” |
4. Click “Get Data”. At this point, your data should appear in the sheet starting from cell C11. You can also modify, refresh, duplicate or show the parameters of the query you just ran. These features come in handy when you need to get different metrics from the same data source for different key results.
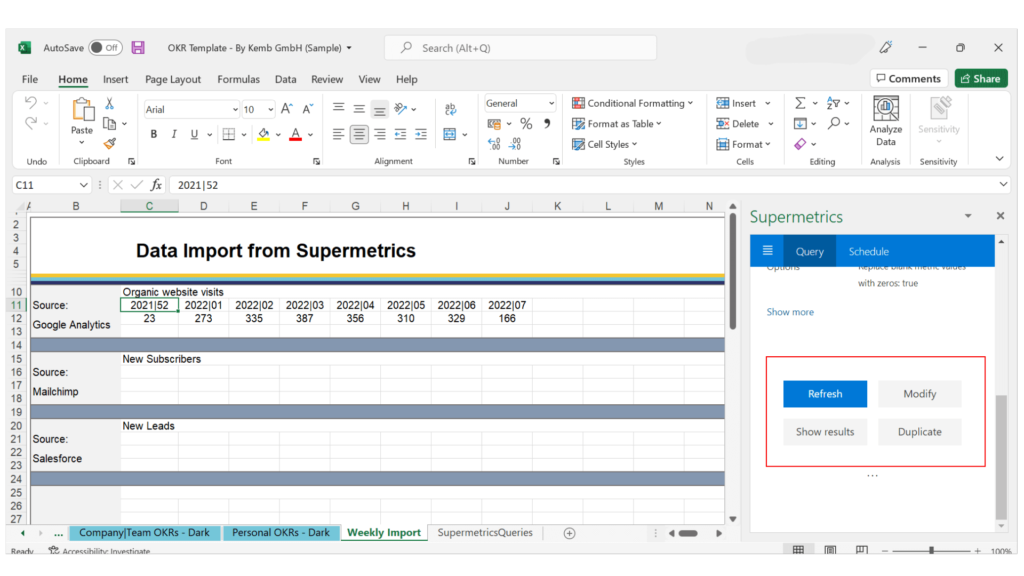
Also, you should notice an extra tab on your sheet called “SupermetricsQueries” which has some instructions from Supermetrics on how to manage your queries:
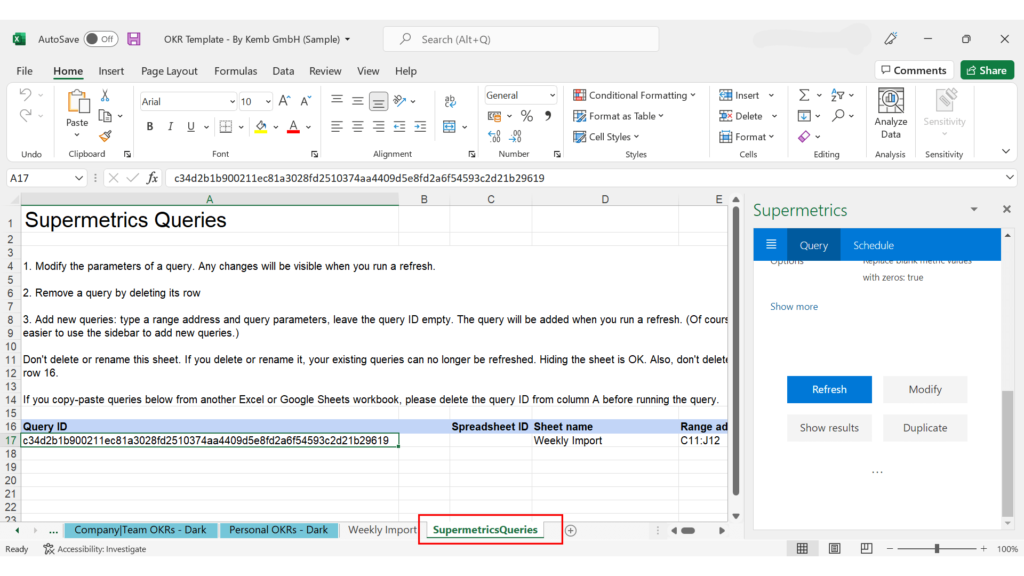
5. Repeat steps 1 to 5 for the second query. In this case, click on cell C16 in the “Weekly Import” tab.
6. Repeat steps 1 to 5 for the third query. In this case, click on cell C21 in the “Weekly Import” tab.
Repeat this process to collect all data you need in order to correctly track your OKRs. Keep in mind that you could potentially import data for multiple key results from the same source using the “Select Metrics” and “Split By” functions. For key results that cannot be tracked with data sourced from any of the connectors available in Supermetrics (e.g. Complete 5 Experiments with the goal of increasing efficiency or effectiveness), we suggest you brainstorm on the smartest way to measure them. At Kemb, our best practice is to build an external sheet that tracks the progress of the key result and links the overall score to the OKR dashboard.
Step 5: Link your results to your target
Now that you have all your data in the “Weekly Import” tab, you can match the actuals/results to your targets. In our template, the “target” is calculated by apportioning the full target 100% based on the number of days in the quarter.
To illustrate this process, we will work with the example mentioned in the first section (1.1).
1. On the “Company|Team OKRs” tab, go to Cell G17 and pull in the data for week 1 from the “Weekly Import” tab by typing =’Weekly Import’!C12.
Note that the metric was divided by the target – total number of visits (In our example, that would be 500).
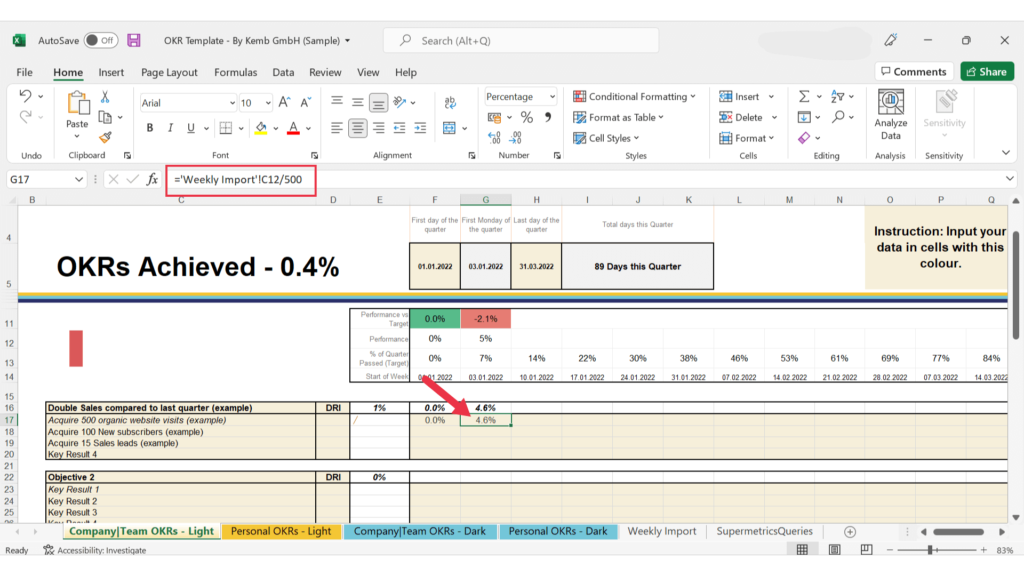
This would give you the percentage of the target that has been achieved so far. Cell G11 would show the performance vs. target.
2. Now for cell H17, the formular is ='Weekly Import'!D12/500+G17
3. Then you can drag this formula to the end of the line (the last date).
Best Practice: Include an If statement that displays nothing for future weeks. For example, for cell G17, the formular would be =IF(G$14>=TODAY(),””,('Weekly Import'!C12/500)) and for cell H17, the formular would be =IF(H$14>=TODAY(),””,(('Weekly Import'!D12/500)+G17).
The sparklines, which show a trend of your performance, will be visible at this point.
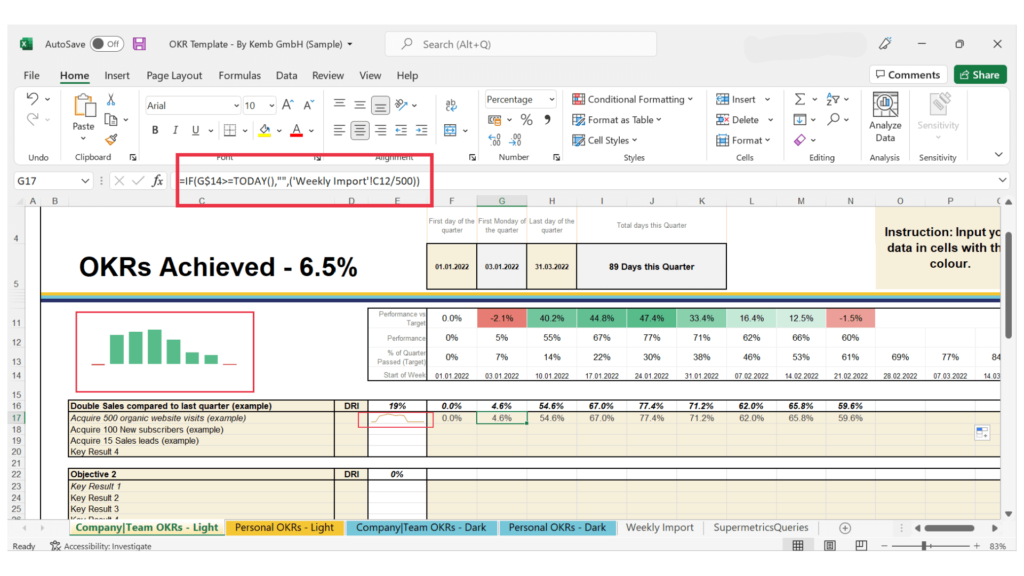
Each week when the Supermetrics query gets updated, the results for the previous week will get updated accordingly. We will discuss the automation process further in the next section.
4. Repeat these steps for other key results whose data are in the weekly import sheet. You can also input your data manually in the yellow/blue cells in the smartest way you deem fit.
Step 6: Automate your weekly refresh
After setting up the dashboard correctly, it is important to set up the automated weekly refresh for the data pulled in using Supermetrics. Please note that the scheduled refresh feature is only available in the paid version of Supermetrics.
Alternatively, you could manually refresh your data weekly if you are using the free version. To do this, on the “Weekly Import” tab, click on the query you want to refresh, navigate to Data >> Show Supermetrics. The query details will be displayed. Then, you can scroll down and click refresh.
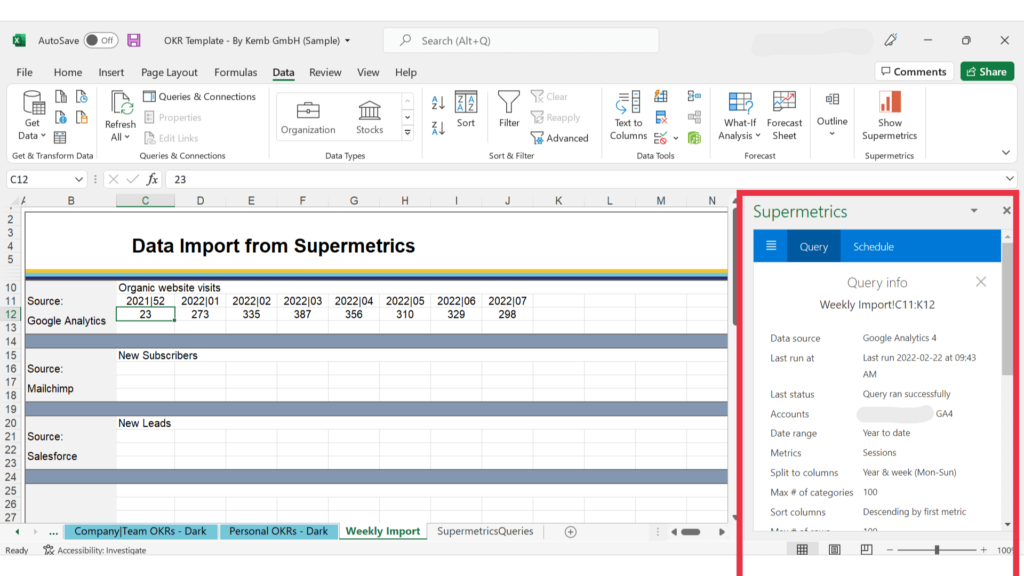
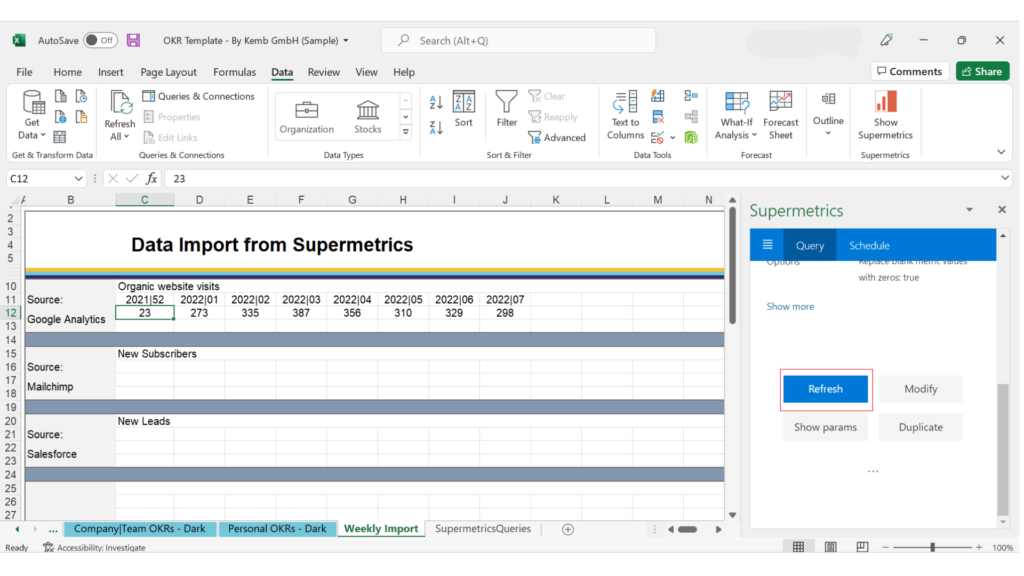
With the paid version, you can automate the periodic refresh by following these steps:
1. Navigate to Data >> Show Supermetrics and click Schedule. You would get a notification to authorise Supermetrics to update the file while offline. After the authorization, you will get a notification to save your file to a drive location. To resolve that, you can simply enable the “Auto Save” feature in Excel and follow the subsequent steps.
2. After saving to a drive folder, scroll down on the Supermetrics sidebar and click “Try Again”.
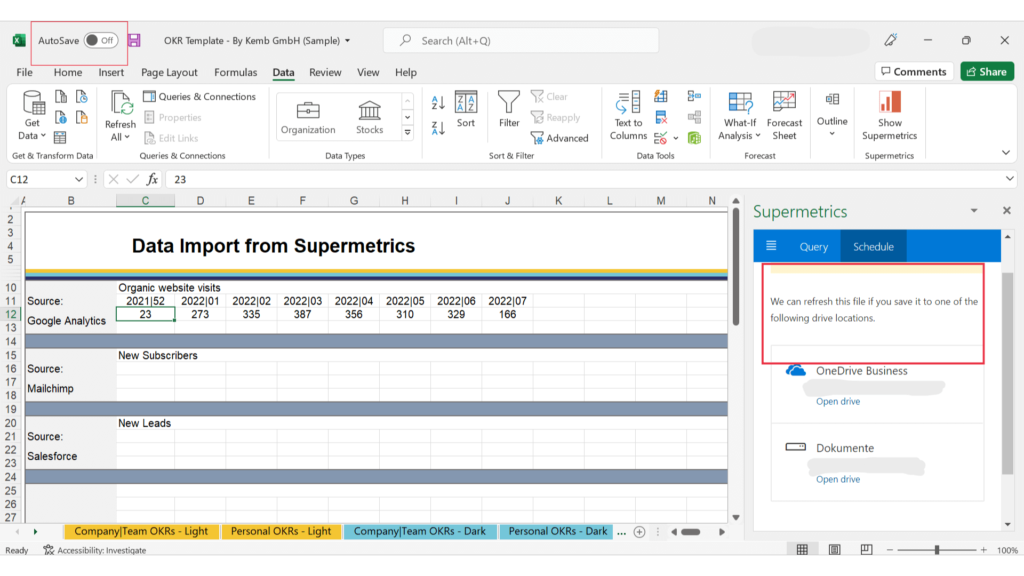
3. Now click “Add Trigger”:
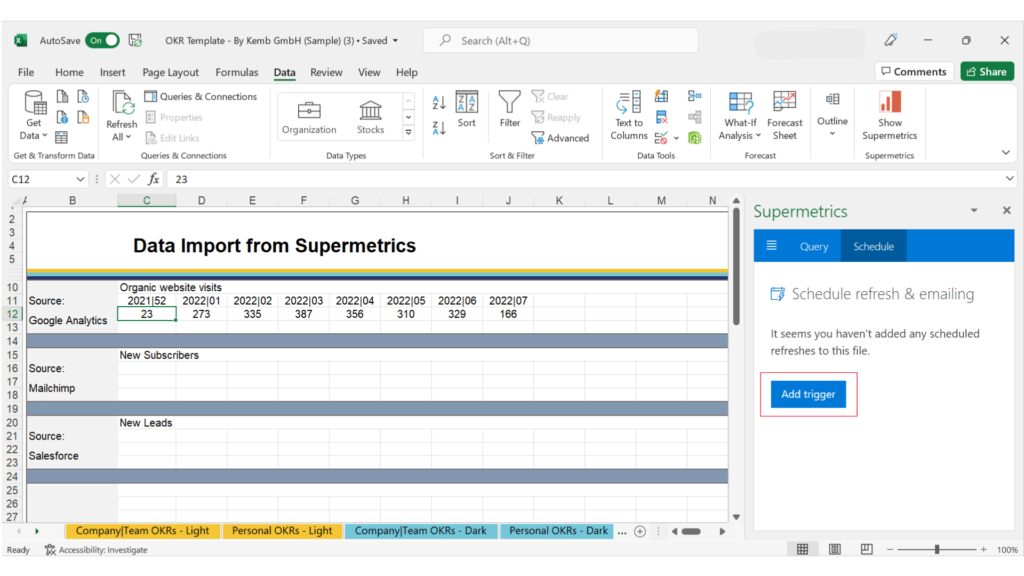
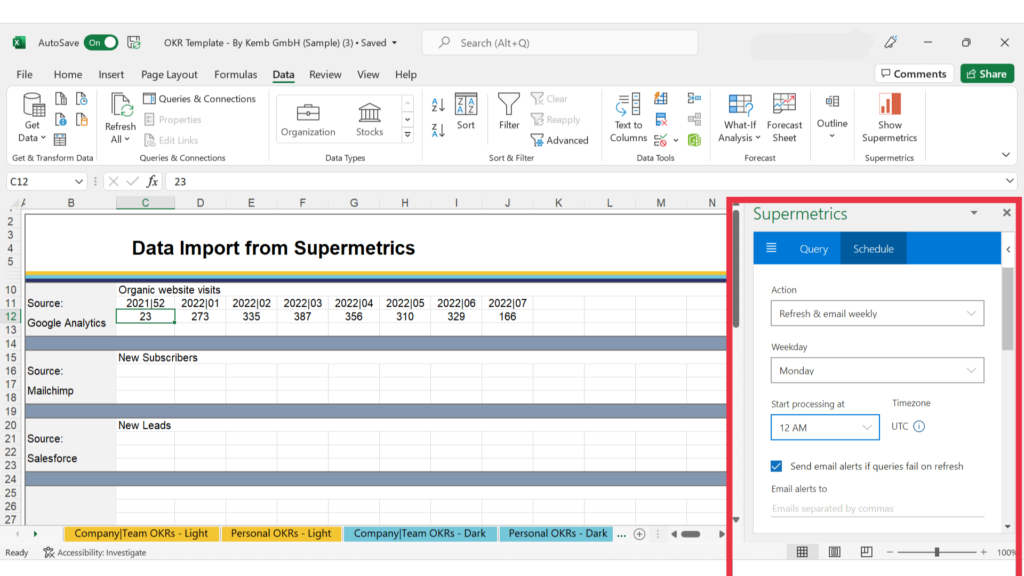
4. Fill out the “New Trigger” form and click save. We recommend you choose the “Refresh & email weekly” option under action and tick the “Send email alert if queries fail on refresh” box so you know if something is broken and needs an urgent fix.
End of Quarter, now what?
Having followed all the above steps, you should now have a fully automated OKR reporting sheet, which you can use on a company, team and personal level. Once the quarter is over, we suggest you duplicate the OKR dashboard tabs and fix all values on one set of the tabs to create an archive of the OKRs for the previous quarter. You can fix the values by “selecting all cells” >> “copy” >> “paste values only” in the same cells. Rename the second sheet for the current quarter and repeat all the steps from brainstorming with team-members on the OKRs for the quarter to automating the weekly refresh.
While setting up OKRs, it is natural to struggle especially if you are not used to creating OKRs. Most often you will start off with a couple of input key results that work more like a checklist than goals. However, you should stick with it as OKRs become really powerful in the long run. Asides from helping you keep track of how much progress you have made as a team, OKRs also encourage collaboration and team spirit throughout your company.That concludes our piece on OKRs and how to automate them. If you have questions, feel free to contact us via our Contact Form. If you also need support automating your OKRs with Supermetrics, we are happy to help.


