Setting your SEO goals and attaching proper KPIs to them is a key step to SEO strategy. You create a solid foundation on which you can continuously monitor your performance. In the daily process, clearly defined SEO goals and KPIs provide necessary orientation for all those involved in the company and thus contribute to the most efficient exchange of information. In the daily process, clearly defined SEO goals and KPIs provide necessary orientation for all those involved in the company and thus contribute to the most efficient exchange possible. If everyone in the team knows – and this can apply to your in-house SEO team as well as the wider team – what objectives and metrics are being talked about, processes also become more transparent for everyone. And it also helps everyone to understand what actions are taken, and to better see their progress and milestones achieved.
Given the infinite variety of possible KPIs available to us in the field of search engine optimization, we want to help you identify the most important ones. And we would like to explain how you can collect these focus KPIs in your daily work and map them in a meaningful way for internal team performance tracking. An SEO dashboard for mapping these KPIs not only provides a systematic overview of general trends. It also serves to quickly identify acute SEO problems and optimization needs in order to dive deeper into specific areas from here and derive necessary actions.
Table of Contents
Onpage KPIs: Your daily doing
When we deal with SEO KPIs, we distinguish between three groups: Onpage, Technical and Offpage KPIs. By onpage SEO we mean all those key figures influenced with the help of measures that are typically assigned to the field of search engine optimization. Hearing SEO, we primarily think of organic visibility of a website, i.e. our placement in search engines, impressions, keyword rankings, website traffic, click-through rates or dwell time on the website. These KPIs basically build up the SEO day-to-day work. You can see how well a website is positioned and how it develops over time by looking at these metrics. The most important ones, which no SEO reporting should lack, are presented in detail below before we adress both technical and offpage measures as well.
These “onpage” KPIs therefore also form our basis for SEO performance tracking. We influence them through actions such as the correct use and optimization of metadata like URL titles and descriptions. Also included in this category are aspects strongly driven by content, such as the design and extent of the content you offer, or how you connect content on your website through clever linking, and many others that are usually attributed to content and search engine optimization.
Using Google Search Console as your most important foundation:
The Google Search Console is a free tool provided by Google to website owners so that they can analyze the performance of their website. To measure data, all you need to do is log in to the GSC homepage with an existing Google account, enter the address of the property you want to track, and then verify the ownership of the domain. To do this, the tool offers different possibilities, the preferred one is to deposit a TXT entry with your domain’s hoster. If you only want to verify a URL prefix property (a prefix property can be a specific subdomain, such as blog.yourwebsite.de; if you only verify this, then this data will only be recorded), there are other alternatives available. Depending on which option you choose, the tool describes different suggestions along with explanations of how to implement them. Of course, you can find a detailed documentation from google directly.
Once your property is linked to Google Search Console, it will start tracking the corresponding data. Please note: You cannot see any of this information retrospectively. The tracking only starts at the time of linking. Therefore, please make sure that you have already linked your property to Search Console and you are not missing out on a huge basis of helpful information about your website’s performance. If you are not certain, best check right after reading our article to confirm that everything is set up correctly. If you have any questions about this or need support with setting it up, feel free to contact us without any obligation and we will help you ensure an ideal tracking setup for your needs.
Search Engine Rankings
The essential goal of search engine optimization? To generate organic traffic for your website. Assessing how well this is done becomes increasingly difficult with each new component that we add to our website. And if you think that this only concerns huge e-commerce websites with thousands of different products, all of which have their own URLs, hundreds of categories and, best of all, a separate blog section, you should be warned. Even small, very specialized B2B companies, with a manageable number of products and the usual information displayed on a company page, usually already have indexed URLs (i.e. pages visible to search engines) in the mid double-digit to triple-digit range. This means that even without too dedicated SEO efforts, the first 100, 200 or more keywords for which the page generates rankings and whose performance can be analyzed and optimized are usually generated quickly. This brings us to the first key indicator of organic performance:
1. Organic Impressions
In our SEO funnel, impressions are located at the very top and are therefore a crucial factor in the holistic review and evaluation of our activities. In a sense, they represent the first measurable point of interaction with our website that takes place via search engines. Whenever users actually visibly discover our website during their search, an impression is tracked. What is meant by “visible”? Let’s assume you wrote an article on “SEO KPIs” (a very creative example) and it currently appears in 15th place in Google search engines when a user searches for the keyword “SEO KPIs”. Let’s further assume that the user is now looking at the first page of Google results only (the first 10 results). In this case, no impression of the user is tracked for our keyword “SEO KPIs”. However, if the user now also wants to view further results than just the first ten, i.e. click on to the second results page (on which our hypothetical article can be found), then in this case an impression is measured for the corresponding keyword and the article that was displayed to the user. Regardless of whether the user clicks on our post or not, that way we get a first impression. Simple as that.
As already mentioned, impressions provide us with an important indication of how visible we are in the first place. This makes impressions and their ongoing development very important for further analysis. If you are not even seen in the first place, you cannot generate any clicks. The KPI not only provides a very useful overall indication of website exposure, but is also an excellent starting point for more specific assessments. We can break down impressions to the individual keyword in order to launch very targeted optimization actions.
2. Organic Clicks
Of course, an impression is only the first step on the road to greater organic visibility. Obviously, we want users to actually view our content, i.e. find their way from the search engine to the website itself, thus taking that next step in the funnel: Exposure and awareness (impressions) we gain in search engines should, of course, translate into corresponding website views. The number of organic clicks is also mapped in Google Search Console. So, based on the available data, you can identify exactly which keywords get the most traffic, which URLs attract the most visitors, and also which keywords users used to reach specific pages.
Using this data, you can then derive optimization measures. Or you might identify new keywords that are currently leading to pages that are not a perfect match. If so, you will have fresh suggestions to create additional content that will present your target audience with an even better-fitting page in future searches for that term. Or perhaps you have recently started a new campaign or launched an additional product feature on your website and would like to analyze how many users you were able to reach with that feature. Filtering the data for specific search terms or other criteria allows you to perform very precise analyses and derive targeted measures.
3. Click-Through Rates
By looking at the click-through rate, we bridge the gap between impressions achieved and the resulting clicks to our website. It shows the percentage of users who have seen a search result of our website on Google and then continued to visit our page.
Unsurprisingly, not every impression results in a click. But the click-through rate can often be a massive lever to increase organic traffic, and it doesn’t always require too much effort. Let’s assume you achieved 10,000 impressions for a certain keyword last month. At a click-through rate of one percent, this resulted in 100 website visitors from this keyword. Assuming you succeed in increasing the click rate to two percent in the following month, you could already acquire 200 visitors instead of 100 in the same period. Besides the position of your search result, the way its content is set up also has an impact on the click rate which we should never underestimate. The better your title and description match the user intent, the more people will click on your result.
Optimizing meta titles and meta descriptions can therefore have a significant effect. You should therefore always keep track of the click-through rates across your website to identify the areas that are most likely to benefit from optimization. For instance, for which search terms or pages do you already achieve a large number of impressions, but only relatively few clicks? At which points do you see particularly low click-through rates? And where have you seen significant deviations compared to a previous period? Using the Search Console data available, you can get a clear understanding of where and for what content click-through rates show particularly large mismatches between impressions and clicks.
While the page that receives most impressions shows a click rate of 6%, the page showing sixth most impressions only reaches a click rate of 1.9% within one month, with +60,000 impressions, resulting in about 1000 clicks. If we could improve this rate to a level similar to that of the top page, we would be able to generate 3600 clicks within a month.
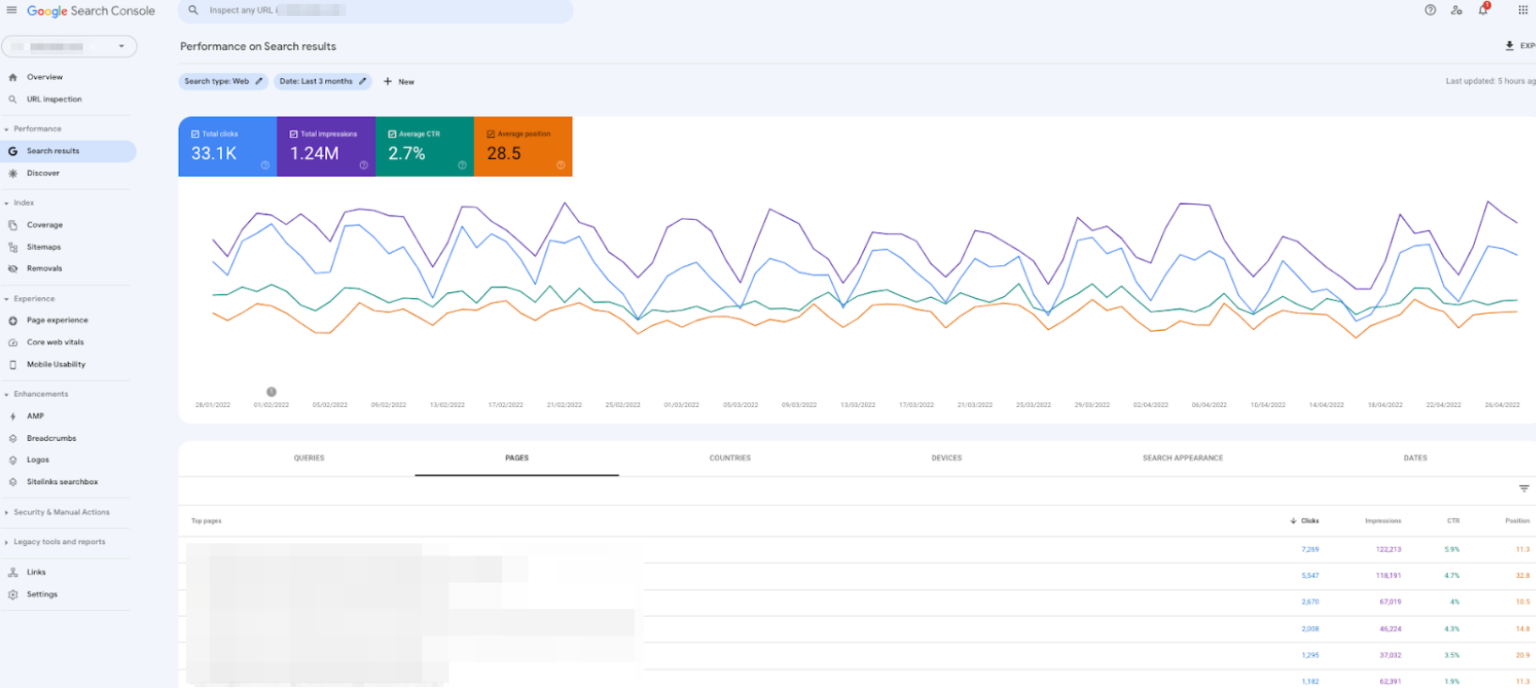
Once you identified potential optimization spots, compare your Google search result with that of other top-ranked sites and test if you can provide even better information in the title or description of your search result. There is no universally valid solution, this is where experimentation and trial & error is called for. Also consider that it can take a while before your changes are adopted by Google and your adjusted results are crawled and displayed in searches. So you should give yourself some time for a final analysis. You should keep in mind to always use equal time periods for comparisons to avoid a distortion of your results.
Sometimes just a more activating call-to-action like “click here for more information” within a meta description suffices to improve click-through rates. Another reason could be that you simply forgot to include your keyword in a title. In other cases, reasons for poor click-through rates are less obvious and require deeper tweaks. The crucial thing is to first identify potential levers.
It is always important not to lose sight of focus with all of the supposed actions. An article on SEO KPIs may not have top click-through rates if people search for “SEA KPIs”, but before hastily revising a title, make sure what your most important keyword really is and what you want to rank for with this specific post. After all, no one, least of all your users, benefits from a search result that promises information not matching what users end up seeing on your site. Besides that, there are other “tricks” to help your search result drive higher click-through rates. Rich snippets can help you stand out more from the rest of the search results and help you gain an advantage over competitors. For example, you can often find stars displayed below a search result which reflect ratings of an article or a product. Additional information that can be displayed in this way includes, for example, prices or product availability.

The example above is equipped with various rich snippets. We can find both the mentioned star rating, as well as a price information for the product. Moreover, there is a product image integrated (in both cases). Due to the prominent stars in the first result alone, this immediately catches the eye of users and can presumably create an advantage in terms of visibility.
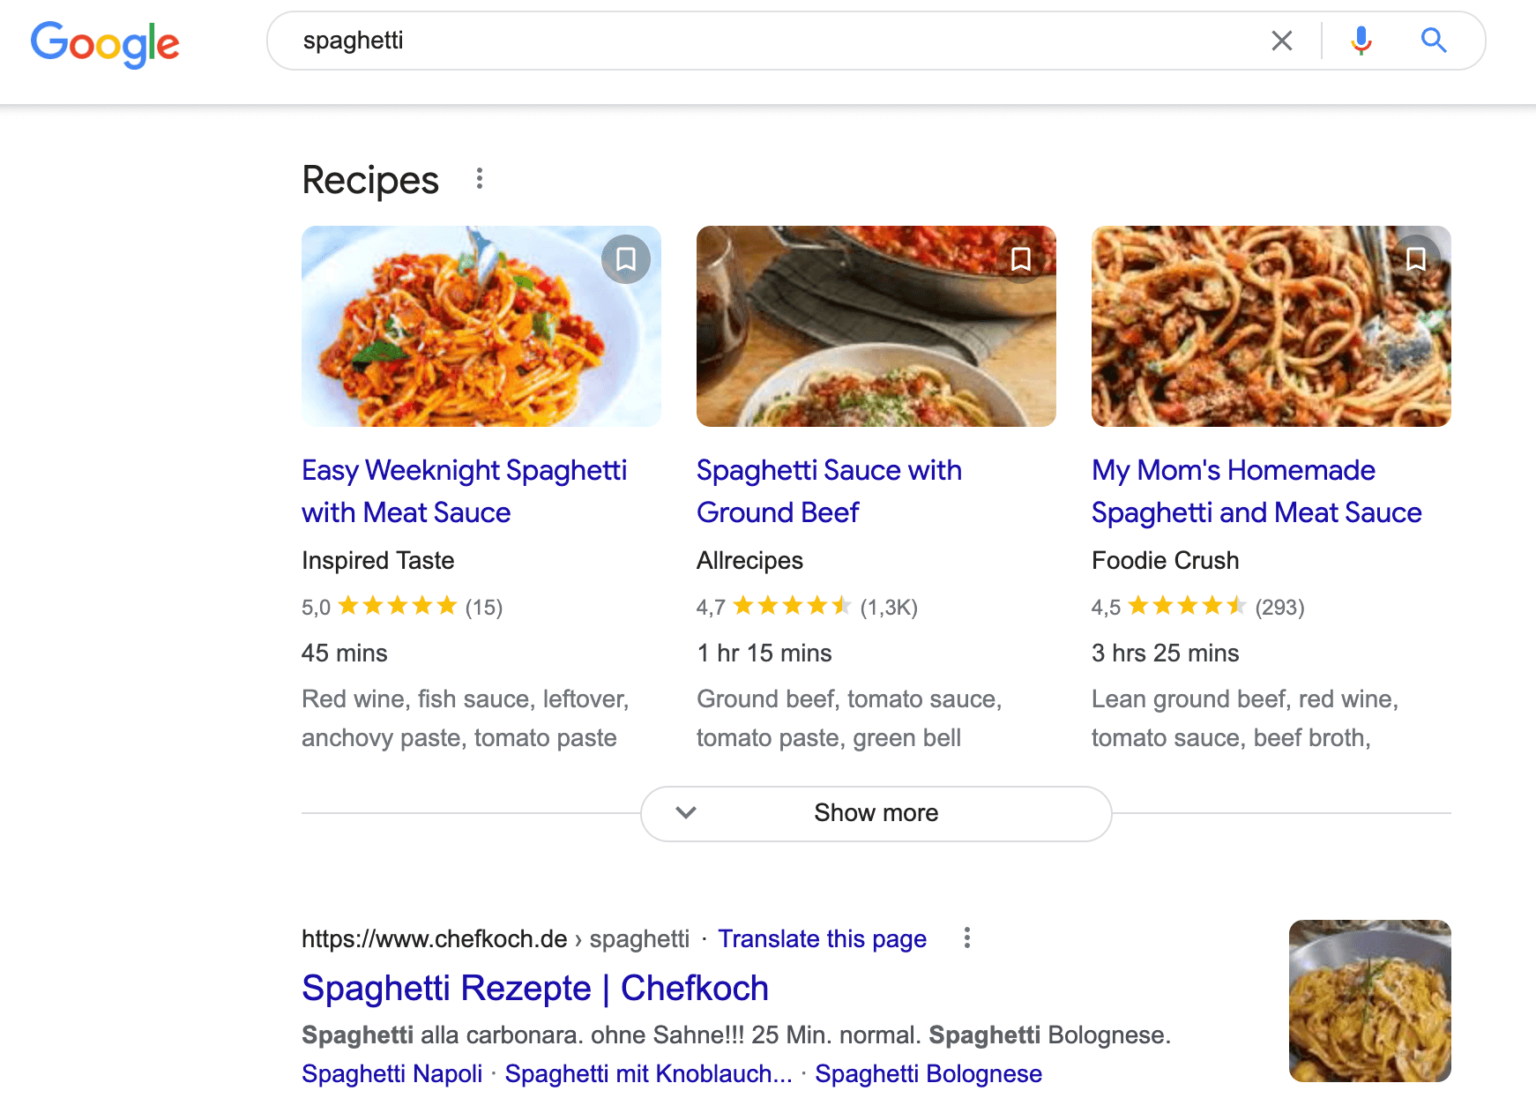
These examples again contain rich snippets, where the content is explicitly marked as “recipes”. These are highlighted and therefore appear ahead of all other results for the corresponding search. You should ask yourself which of the results will catch your eye, the three side-by-side results, or the first one that follows (and try to ignore your personal pasta preferences when judging). Aside from these examples, there are many other types of rich results that could increase your search result’s visibility and improve your chances for clicks.
Of course, with all possible implementations, you should carefully consider when and how to include the appropriate components. Depending on the type of content, such highlighting could also have negative effects. A star rating may appear irritating or even dubious below an article on a very complex subject. In addition, there are many other forms of possible rich results that can give your search result more visibility and thus better click chances. So always consider whether or not these elements could really be beneficial and always test the impact your adjustments have had.
4. Average Position
In addition to the click rate, an analysis of your average position for keywords and URLs also helps to establish a more accurate connection between impressions and clicks. Because clearly the position also has an influence on how many clicks you receive for a particular search result in the end. The higher you rank for a particular keyword, the greater your share of impressions for the search term and, as a rule, the higher the associated share of clicks. The results of IgniteVisibility’s research impressively underscore the findings. For example, search results ranking at position 1 have an average click-through rate of over 40%. At position 5, the click rate is already only about 10% and drops further in half to only about 5% at position 7.
To analyze your positions, it is important to understand how the corresponding values, which are displayed in the Google Search Console, come about. Google itself explains this:
“The position value shown in the Performance report is the topmost position occupied by a link to your property or page in search results, averaged across all queries in which your property appeared.
1. Query 1 returns your property at positions 2, 4, and 6: its position is counted as 2 (the topmost position).
2. Query 2 returns your property at positions 3, 5, and 9: its position is counted as 3 (the topmost position).
3. The average position across these two queries is (2 + 3)/2 = 2.5.
A link must get an impression for its position to be recorded. If a result does not get an impression—for example, if the result is on page 3 of search results, but the user only views page 1—then its position is not recorded for that query. In some report configurations you might see a dash (-) for the position value. This means that there is no recorded position because the user never saw your property for that query. For example, if you compare desktop and mobile results for a page that has 10 impressions on desktop but none on mobile, you’d see 10 for desktop and – for mobile.”
SEE: HTTPS://SUPPORT.GOOGLE.COM/WEBMASTERS/ANSWER/7042828?HL=EN#POSITION
In-between conclusion: Never look at metrics in isolation
We hope we’ve not only helped you gain a little more insight into some of the most central metrics you should always keep in mind when auditing your SEO performance. Just as much, we want to raise awareness of how to use them as efficiently as possible. This requires an understanding of exactly how they influence each other and the interactions that exist between them. Otherwise, you can quickly get lost in small-scale analyses and optimizations for a single value and lose sight of important interrelationships and the bigger picture.
Let’s say you notice that a certain page gets significantly fewer clicks than you expected, then take a look at how many impressions it receives. What are the keywords generating those impressions? For example, does this page lack a term that they consider particularly relevant? How could you optimize the page to target this keyword? Or maybe you selected an ideal keyword, but the search term simply isn’t searched for often? You might also find that the click-through rate for this very page is significantly lower than for some of your top performers. So what search results are your top competitors offering? What could you learn from their description, where could you fill gaps? You should always keep questions like these in mind when considering optimization ideas.
Google Search Console offers many possibilities for detailed analysis. So here are a few more fundamental tips on how to use it:
1. Using Google Search Console: First get an overview of general trends
Click on the “Search Results” tab and select the time period you want to analyze.

You can select what type of content you want to view in the Search Type field. By default, the web type is selected. You can also choose to analyze the performance of images or videos explicitly. Depending on the requirements of your business field, these categories will of course be more or less important. We will stick to the default settings for our analysis, because we want to focus on the page level and all textual content.
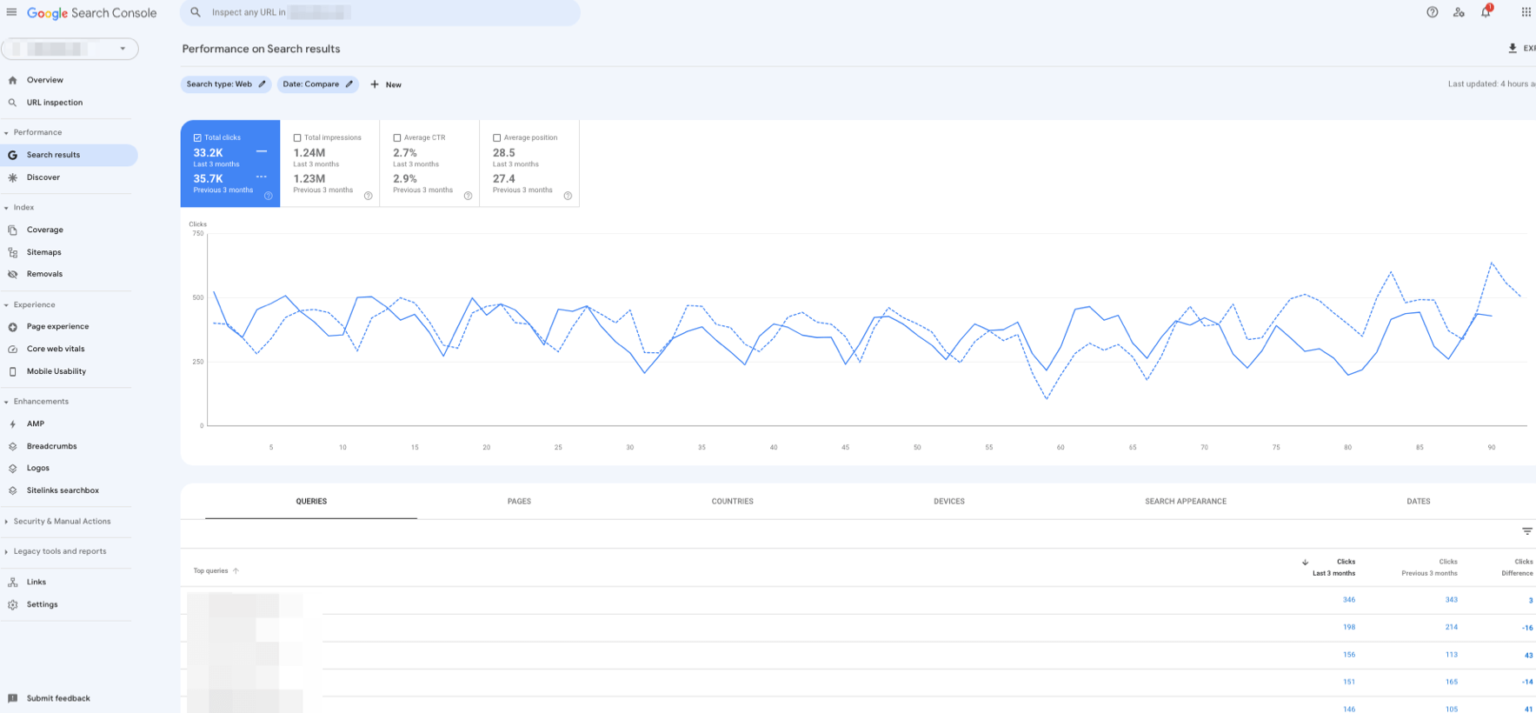
Next to this field, you can specify the period for your analysis. So how did the key KPIs develop recently? Select a period of several weeks for your initial analysis and compare these values with an equally long prior period.
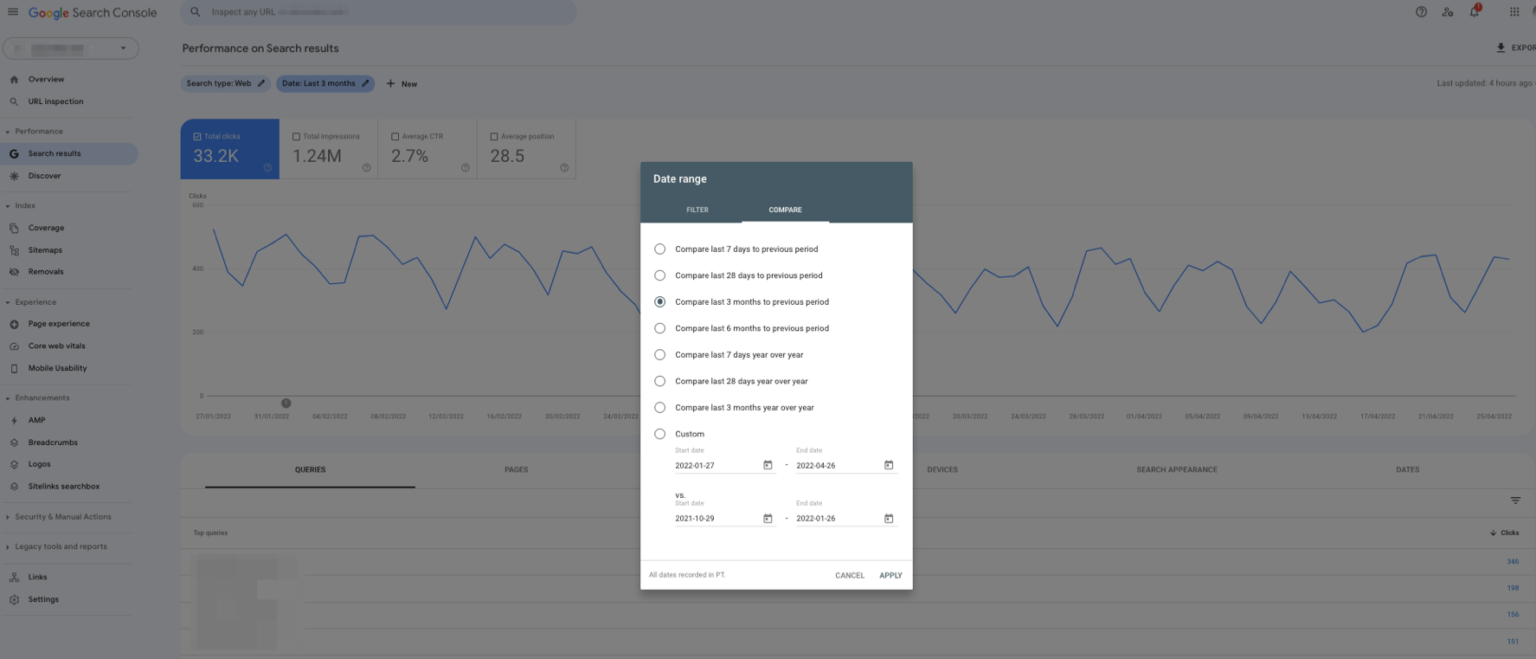
In our example, we cannot observe any serious changes on a global level to start with. A slight decrease in the average position and click rates, which does not give cause for concern for now. Beyond that, there are no massive drops or even increases compared to the previous period.
2. Focus on data that really matters
The bigger the website, the more data points to consider and evaluate. This makes the use of filters all the more important. Here, Search Console also offers appropriate capabilities. For example, you can explicitly display the data for a specific region. If you are primarily engaged in Germany, for example, we also recommend adjusting the focus of the analysis accordingly. A global data view can water down your findings. To illustrate, let’s look at our example again by limiting the analysis to Germany.
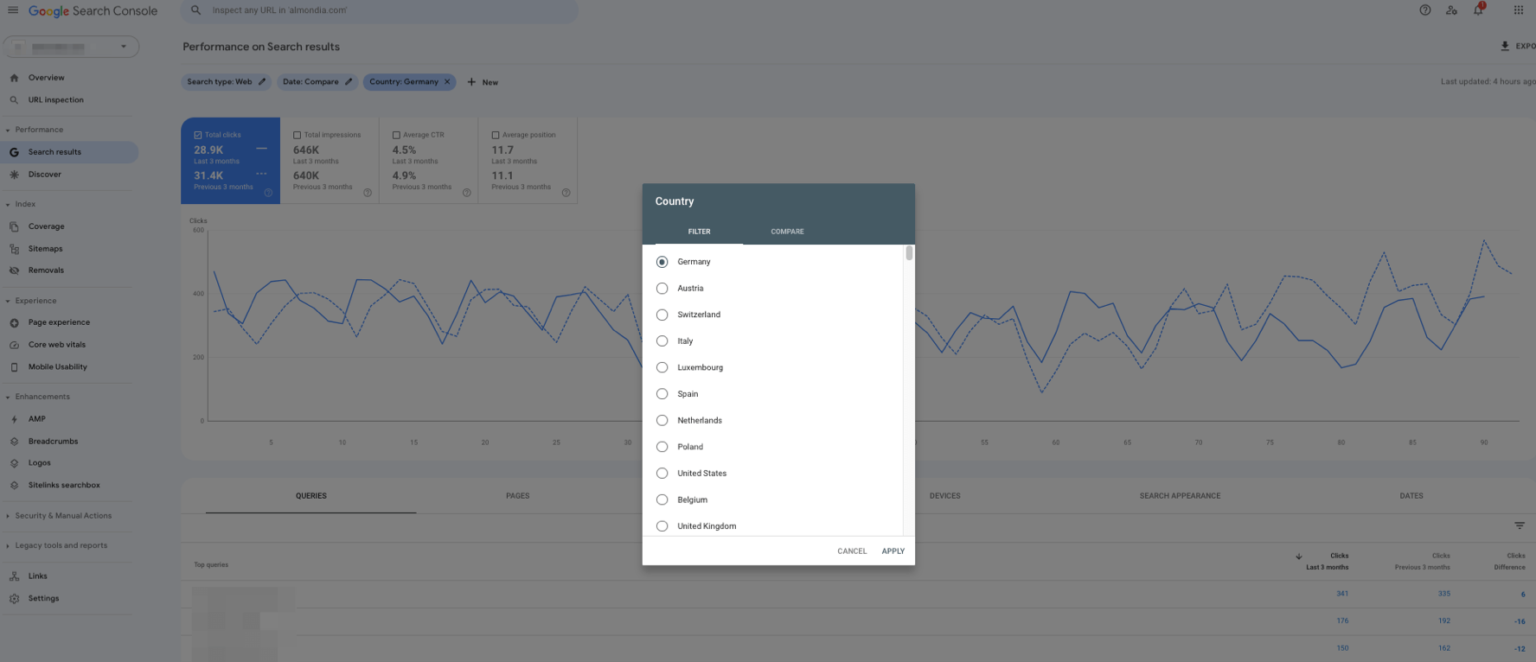
Compared to the overall view, we immediately notice considerable differences:
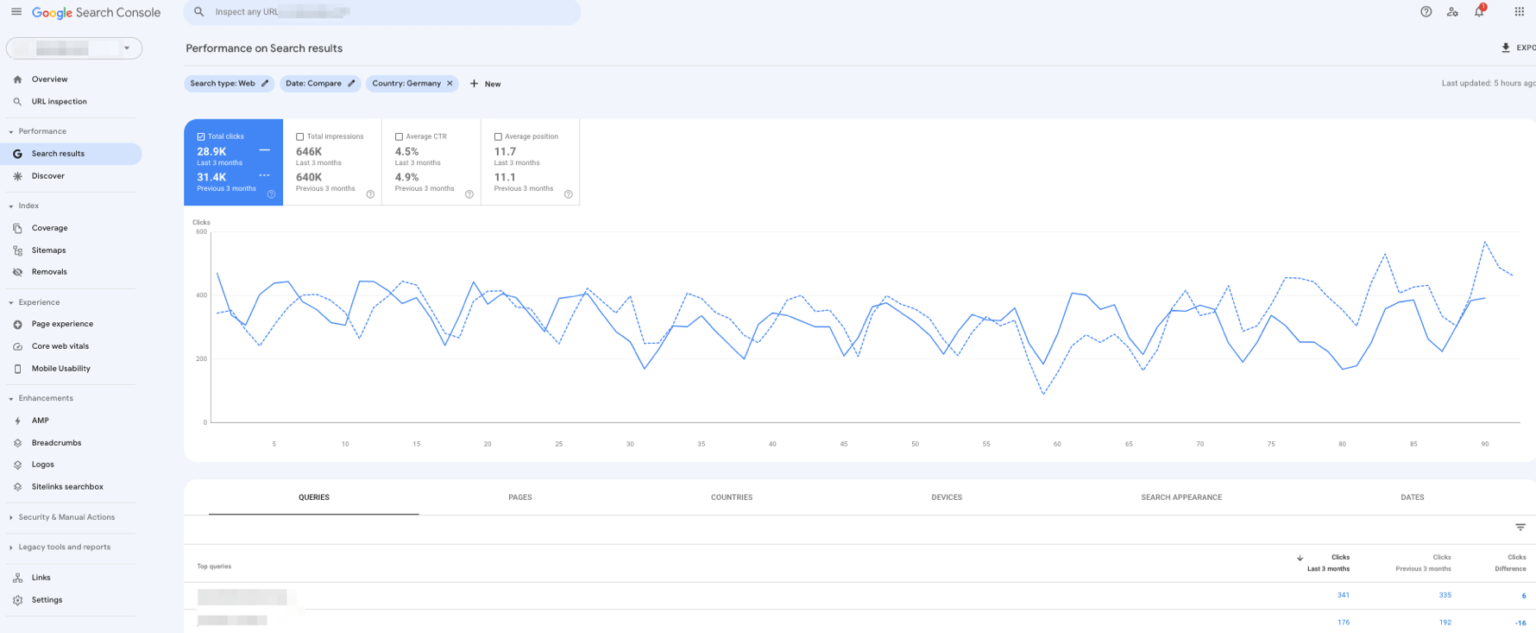
If we are primarily seeking our customers in Germany (and want them to find us here), then it is of little relevance how many people in the UK find our pages among the top results. So, in order to make specific analyses and identify optimization measures, you should always keep in mind FOR WHOM you actually want to optimize. If we consider the average position, for example, for our target market this is on a completely different level than on a global scale (11 vs. 29). And of course, you can also make comparisons of multiple target markets. For example, what about our visibility in neighboring countries?
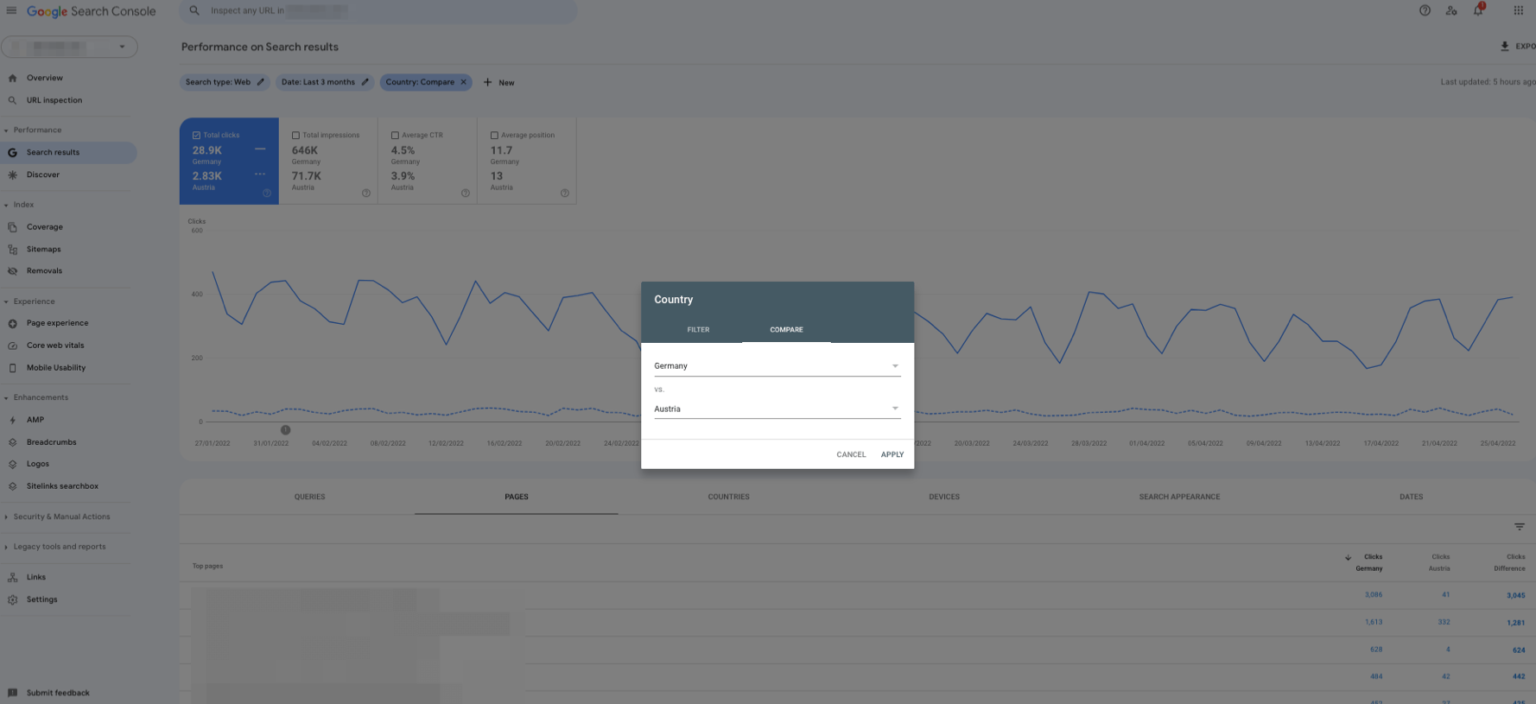
When we compare our online presence in Germany with that in Austria, not surprisingly we find that there are significant differences in terms of impressions and clicks, which is of course due to the population differences between the two countries. After all, click rates and average position are at a similar level.
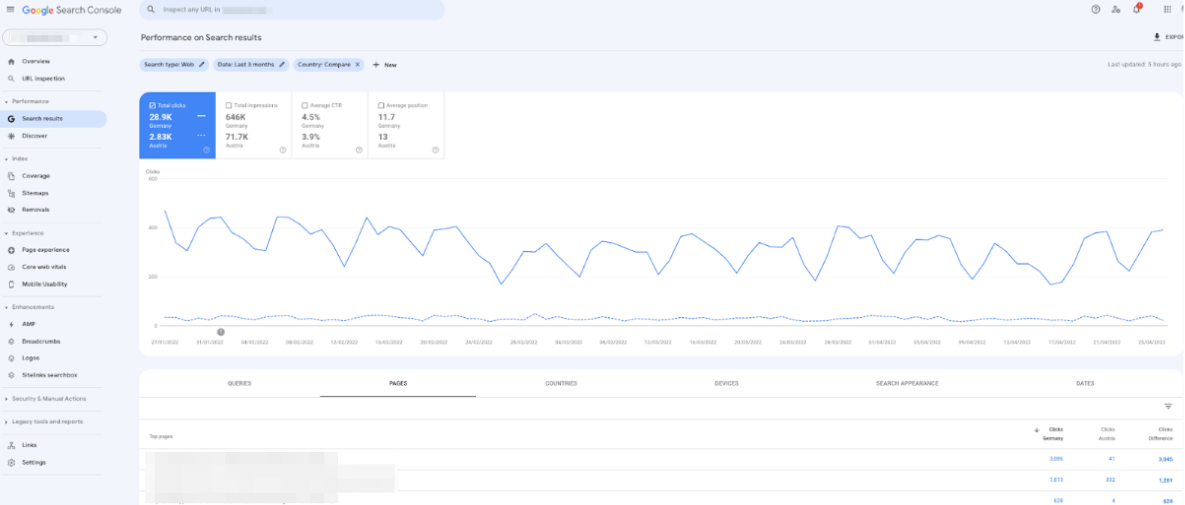
Should we be interested in the market and want to get more out of it, a more detailed analysis on the position may provide a first starting point. As mentioned, although the differences are not severe, they are visible (11.7 vs. 13). By taking a closer look at ranking keywords below the chart, for example, we can look at where the biggest discrepancies exist and go into a deeper analysis of possible reasons.
3. Further filter your data
In addition to using a country filter, we highly recommend the use of keyword or page filters. After all, not all pages are equally relevant to your SEO performance. Perhaps you run a blog section that you primarily use to build organic traffic. In this case, filter your data so that you only see results for URLs located in the appropriate folder.
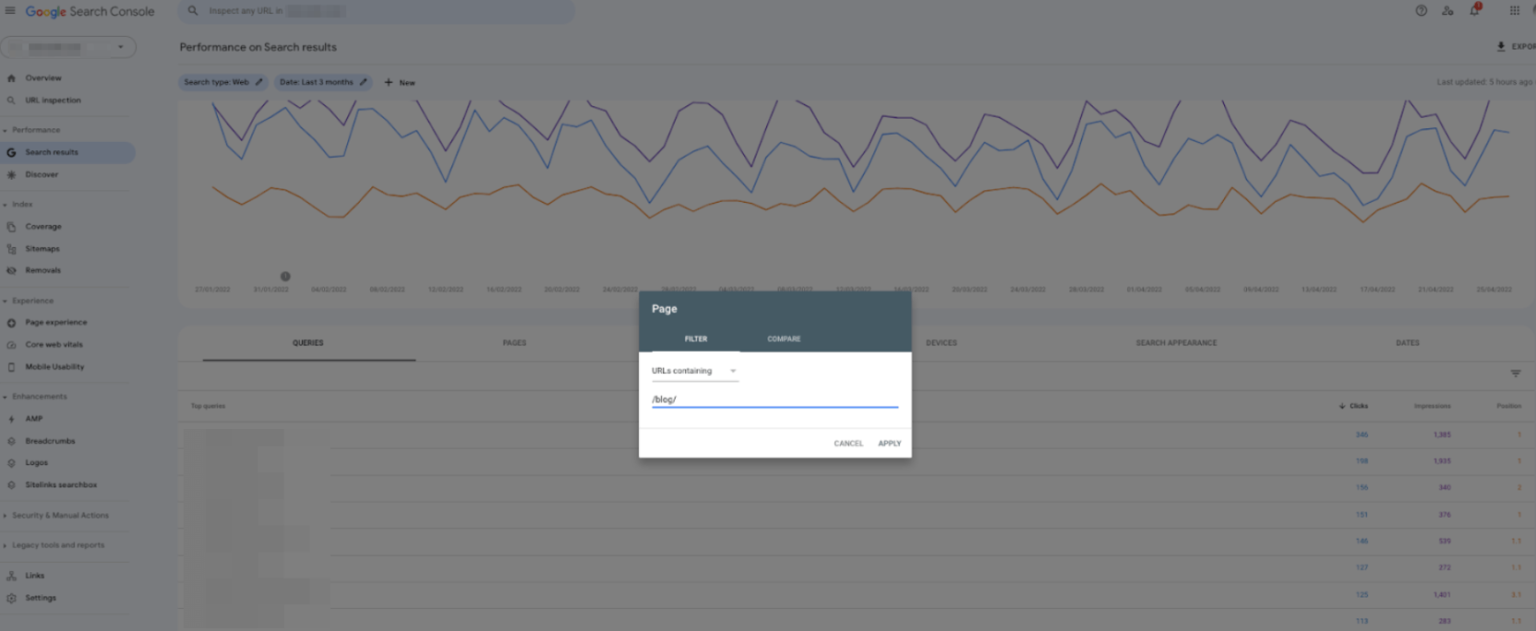
You can also be even more precise by applying filters. For example, to perform a targeted analysis for a specific keyword, you can enter the keyword in the filter to only display results where the search term appears.
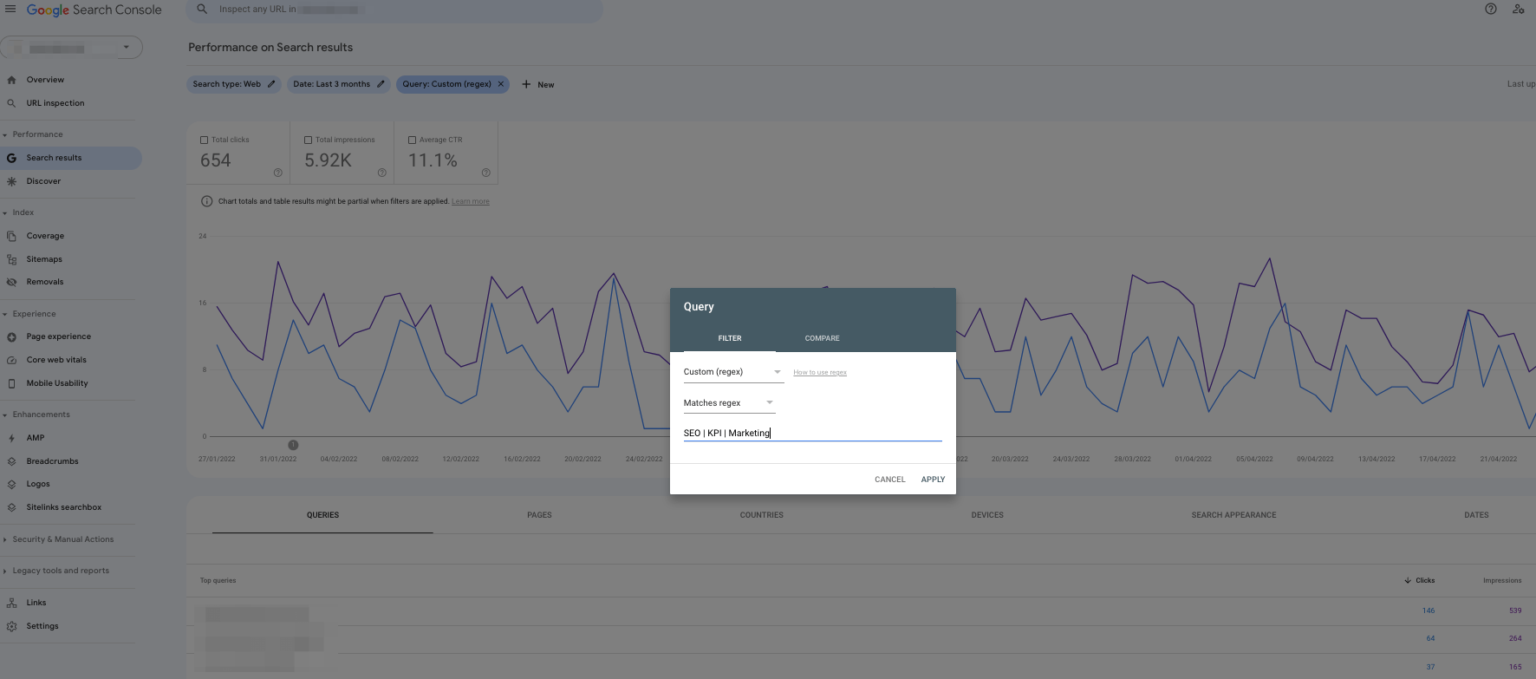
With the help of regex filters (filteriny by regular expressions), you can take an even more individual approach and, for example, capture groups of terms. For example, if you have a defined set of focus keywords that are particularly important to you, you can display the results for this group of words collectively. To do this, simply select the “Custom (regex)” filter and enter the terms as follows: YOURFOCUSWORD | YOURSECONDFOCUSKEYWORD | YOURTHIRDFOCUSKEYWORD. Or you may want to evaluate brand performance, then filter accordingly for specific keywords to perform an accurate analysis of your brand’s organic visibility.
There are quite a few ways to break your data down further and use filters effectively. We suggest you identify which fields are of greatest interest to you and then drill down to what will give you the most accurate results for your individual needs.
ATTENTION! We do not want to leave one important limitation unconsidered: As soon as you perform data filtering, Google Search Console no longer reflects results in full, but based on samplings of your data. Unfortunately, this limitation cannot be avoided in Google Search Console. Google also provides an explanation for this. In any case, you need to be aware that you might not be able to see all of your data broken down to the last keyword.
Anyway, Search Console’s own mapping is always limited to 1000 results displayed. So if you rank for 5000 different results, you will still only get the information about your top 1000 results. Especially for smaller websites, the information available usually is sufficient. However, especially for larger websites, we found that samples sometimes only represent a small fraction of all data. But it is possible to further increase this database and data quality. One way to do this is to extract raw data using the Google Search Console API. We are happy to support you in the implementation of a suitable solution to connect and maintain data, as well as in setting up a comprehensive SEO reporting based on all available raw data for the most specific analysis possible.
Further on-page KPIs
Having covered the key elements for analysis, we will of course go one step deeper. All information on rankings is a starting point, but not the end of the process of analyzing SEO. Therefore, we do not want to ignore other core KPIs. The previously provided recommendations on how to handle the relevant data still apply. I.e. we always keep an eye on interactions between KPIs and look at larger contexts instead of just relying on punctual and very specific impressions. In our example, we take a look at the connected Google Analytics 4 property for our website or use the preferred tool for analyzing the website performance. Of course, we can support you with the implementation of suitable solutions.
We don’t want to go into too much detail on individual KPIs at this point, but we recommend you always consider these metrics when assessing organic performance. We would like to give you a few guiding questions along the way.
5. Traffic Channels
What is the traffic share of organic search compared to other sources? Within the traffic acquisition section of your GA4 property, you can compare the different channels or explicitly filter for the various sources or mediums that bring users to your website. To get an idea of how relevant organic search is for your website, we recommend to compare it with other channels and see how they perform over time. For example, if overall traffic has been stable, but you have seen shifts between channels, you should analyze possible reasons.
It is not uncommon for successful search engine optimization to have an impact on direct traffic. This may result in shifts from organic to direct traffic. This is not necessarily a disadvantage; on the contrary, it may well be a positive signal that users who initially found you using search were convinced enough to visit your website directly instead of just using Google search. Also, it is not uncommon to see similar trends for direct and organic traffic. Just try to keep things like these in mind when reviewing your acquisition channels.
6. Average Time on Page / Average Engagement Times
In Search Console, we can first see how prominent our pages and keywords are in searches, but with the data available in Google Analytics, we can collect more information on their performance. Not least, how much time users spend on a page on average (Google Analytics 4 no longer reports the time spent on the page, but the engagement time instead). Again, for detailed analysis, use additional filters to uncover differences between new and returning users, for example. Perhaps there is content that is better tailored to one group or the other. Open the engagement report and select the Pages and Screens section. Next, apply a filter to only show values for your organic visitors, or create specific audiences for even more targeted analysis.
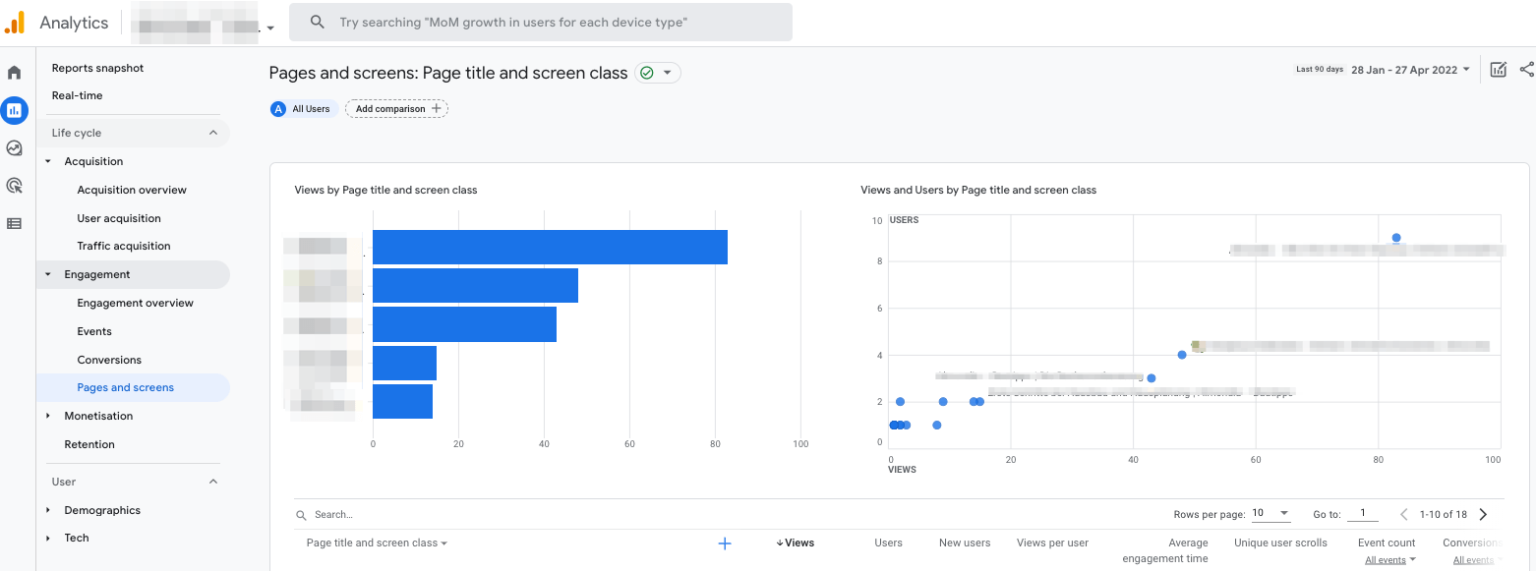
7. Engagement Rates
As already mentioned, in Google Analytics 4, unlike in Universal Analytics, you will find more comprehensive data on how users engage with your website. To do this, call up the entire Engagement section and, in addition to Engagement Times, you will find other relevant data for measuring user engagement. You should constantly keep track of it as well.
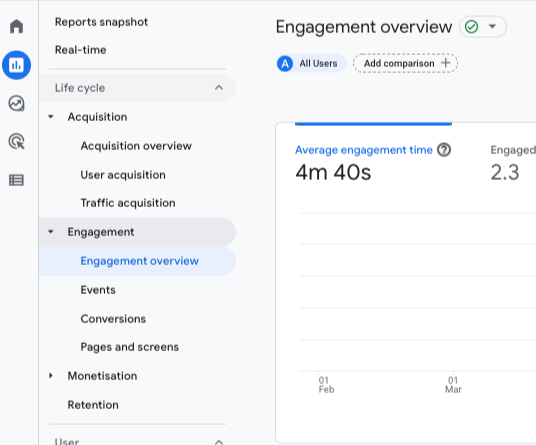
Please do not underestimate its value for your SEO success as well. Google keeps track of how users interact (or don’t interact) with your pages. Therefore, by improving the metrics, not only will you increase user experience, but also your chances of better rankings. Along these lines, you may be wondering about the bounce rates of individual pages. In another article, we got to the bottom of the question of where the bounce rate has gone in Google Analytics 4.
8. + 9. Conversion Rates & ROI
What is the return of your SEO efforts? Of course, conversion rates and your ROI should not be ignored when analyzing your SEO activities. Find out which pages have the best conversion rates, see where there may be room for improvement, and learn which content may not result in many conversions but still delivers large numbers of new users in your analytics reports. A little more complex but just as important is the question of your return on investment. Here you should try to develop a proper solution to put your SEO or also your content budget in relation to your return on investment.
For example, you might look at the amount you spend on your efforts per month (staff costs, outsourcing articles if necessary, performing technical adjustments on your website, etc.). You could match this with the number of monthly organic website users. This will at least allow for an indication, which can also be helpful when discussing with other teams. On that note, we would like to raise awareness of just one more aspect: Never judge your SEO optimizations purely based on metrics of organic performance. Or don’t you think that a highly optimized site will also provide better experiences to all those users who may have landed on your site through paid ads or directly?
To assess your overall marketing activities, we also recommend taking a closer look at our article on the 10 most important marketing KPIs. Here we delve into cross-channel metrics and describe in detail how you can best track them.
So much for the daily tools for optimizing your SEO. Finally, we would like to give you an outlook on other important fields to boost your organic rankings.
10. – 13. Technical SEO: Indexation, Crawl-Stats, Core Web Vitals, Mobile-Friendliness
In addition to our conventional onpage factors, we want to explicitly distinguish one more area of technical SEO. Undoubtedly, there are overlaps with the field of onpage SEO and many will argue that the use of metadata is already a “technical” issue. What we are aiming at when talking about technical SEO are fundamental and far-reaching implications in technical setup that greatly influence the SEO performance of a website. Starting with the setup for content indexing and crawling, and ending with topics that are usually more classified under UX. Why? Because SEO and UX have merged more and more in recent years, and UX factors in particular are becoming increasingly important in search engine optimization.
Quite a few ranking factors are taken into account in the Google algorithm. Long gone are the days when only the correct placement of a keyword was essential for a high ranking. Page experience has become an increasingly important issue that also has a growing influence on SEO success. Pagespeed, core web vitals, mobile-friendlyness, all these factors have a direct influence on user experience and hence at least indirectly on important signals that are being registered by search engines.
Let’s take an example: A user comes across one of our articles while searching on a smartphone. By clicking on our search result, the measurement of quite a few relevant metrics begins, each of which can affect the “rating” of the quality of it. Even the supposedly best article will deliver poor bounce rates if the page doesn’t load fast enough. Especially with mobile usage, users often return to the search results instantly and choose an alternative quickly. The search engine, in turn, registers that users apparently did not find what they were looking for on our (poorly performing) page. In the end, it doesn’t matter whether the content could have theoretically been there if only the user had waited long enough. Numerous factors play a role: are relevant graphics and images loaded in time, is the content text big enough across different devices, do menus allow easy navigation on a smartphone, are links made clearly visible, etc. etc.?
These issues all have at least an indirect impact on the SEO metrics mentioned above, such as bounce rates and engagement rates, dwell time, the total number of pages visited, and scroll depth when browsing the site.If it is technically difficult to consume content, if reading articles becomes unnecessarily stressful, then this often goes hand in hand with low retention rates on the site. If content is not interlinked in a way that is easy to see, or if its structures and menus are not optimized for mobile users, and if everything takes far too long to load anyway, this will also result in poor SEO signals.
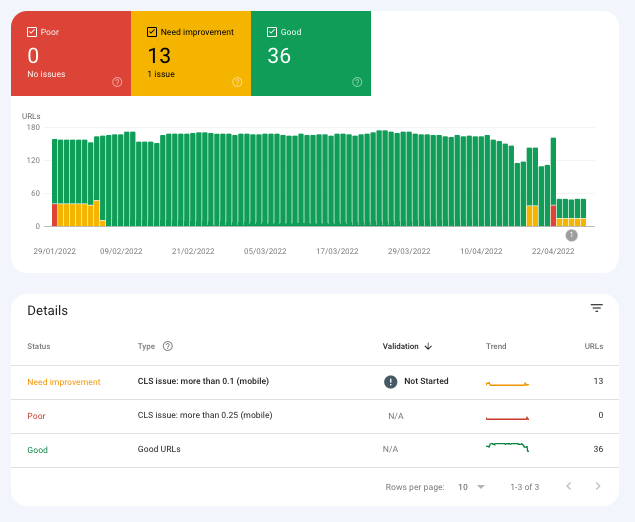
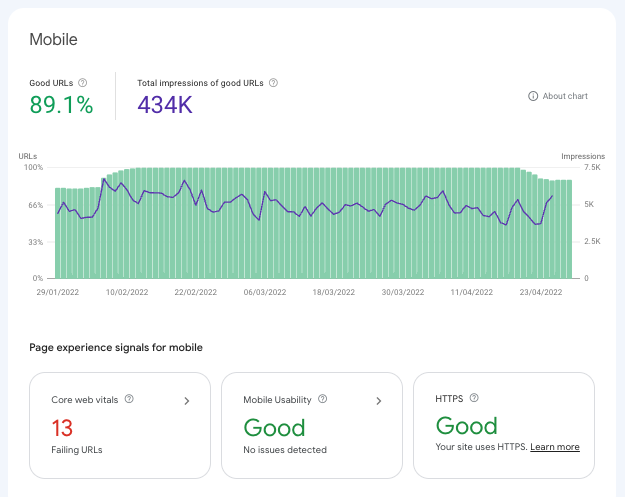
Page Speed has been a well-known ranking factor for years. After initially being limited to desktop versions of websites, speed performance was also added as a relevant factor for the ranking of mobile pages, as Google already officially confirmed in 2018. With plans for a complete switch to mobile-first indexing from March 2021 onwards, Google wanted to move to a 100% mobile indexing of websites as the basis for rankings. Although google has indefinitely postponed the deadline for a complete switch to mobile-first indexing, the importance of mobile-friendly websites will not decrease. In a further step, additional page experience updates were rolled out by Google by the end of August 2021, which give even greater weight to the factor (as the sum of core web vitals/speed, mobile performance, security aspects, and others).
Google’s John Mueller himself summarized on this back in 2020:
„Depending on the sites you work on, you might notice it more, or you might notice it less. As an SEO, a part of your role is to take all of the possible optimizations and figure out which ones are worth spending time on. Any SEO tool will spit out 10s or 100s of “recommendations”, most of those are going to be irrelevant to your site’s visibility in search. Finding the items that make sense to work on takes experience.
The other thing to keep in mind with core web vitals is that it’s more than a random ranking factor, it’s also something that affects your site’s usability after it ranks (when people actually visit). If you get more traffic (from other SEO efforts) and your conversion rate is low, that traffic is not going to be as useful as when you have a higher conversion rate (assuming UX/speed affects your conversion rate, which it usually does). CWV is a great way of recognizing and quantifying common user annoyances.“
SEE:HTTPS://WWW.SEROUNDTABLE.COM/GOOGLE-PAGE-EXPERIENCE-UPDATE-TIEBREAKER-31880.HTML
John Mueller’s words capture very well what (and why) we should also aim for when it comes to evaluating SEO measures and what we therefore want to draw attention to. A successful SEO strategy will never be based on the optimization of individual factors, but should always take various factors into account and be accompanied by an understanding of their interactions. Only by doing so can we take a holistic approach which is not focused on the optimization of individual KPIs in isolation, but instead has a positive impact on the user experience as such in the long term.
14. Off-Page SEO: Backlink-Performance
A third field, which of course also has great weight in terms of SEO performance, is the so-called off-page SEO, i.e. all measures that do not take place directly on the own website and have an impact on its organic ranking. Without a doubt, you should also keep the most important off-page KPIs on the screen in your daily doing, but these are often much more difficult to control or influence on your own. Various off-page signals can influence how a website ranks. In the broadest sense, the measures are probably comparable to those of classic PR or brand marketing. Generating visibility on relevant external sources, for example through forum posts, guest posting on any major platform, or content distribution through external content creators and influencers can add exposure to the brand. Perhaps the most important metric associated with this, i.e. the most relevant indicator, also from an SEO perspective, for assessing the quality of measures: your own backlink profile.
High-quality backlinks, i.e. ideally follow links from relevant sources, authority domains, blogs, forums or news sites from within your industry, can have a positive effect on SEO rankings in a number of ways. First of all, of course, they can directly translate into added traffic for a linked URL. In addition, they can increase your visibility for specific keywords (for example, if x prominent websites link to your article on marketing KPIs with the anchor text “SEO KPIs”, this sends strong signals to search engines). Lastly, links from relevant sources affect the overall profile of a website and send signals about the authority and relevance of the website as a source. However, don’t overestimate the value of active, manual backlink building when you look at the big picture, as effort and return are often out of proportion from a pure SEO perspective. Here, time is often more effectively invested in other measures.
Take your SEO performance to the next level
You know that search engine optimization is a broad field offering a wide range of possibilities for fine-tuning and action. Perhaps the biggest challenge in the face of such vast possibilities for optimization? To miss the obvious. All the more important is a well-organized reporting process that helps you prioritize and identify key levers. Please feel free to contact us and discuss your requirements. We will be happy to support you in tracking your SEO success.

