If you’ve been working in a marketing team for a few years, you’ve probably heard people say, “the marketing teams, the ones that spend the money and do the creative things,” however, this term is slowly losing its credibility – for the better. The success of your marketing strategy demands a lot more than creative thinking and ingenuity. Sustainable decisions ensuring your company’s profits rely on the regular gathering and analysis of your data. So, together with the team of y42, we sat down and wrote down the ten most important KPIs for marketing teams and how to track them.
The foundation of a successful marketing team lies within a combination of understanding your Audience, Products or Services, the Channels you can leverage, and finally, your data to know if you are successful at understanding A, B & C. Within this article, we will solely focus on the last part, understanding if you are successful at your marketing activities.
Table of Contents
KPIs – your indicator for your marketing health and success
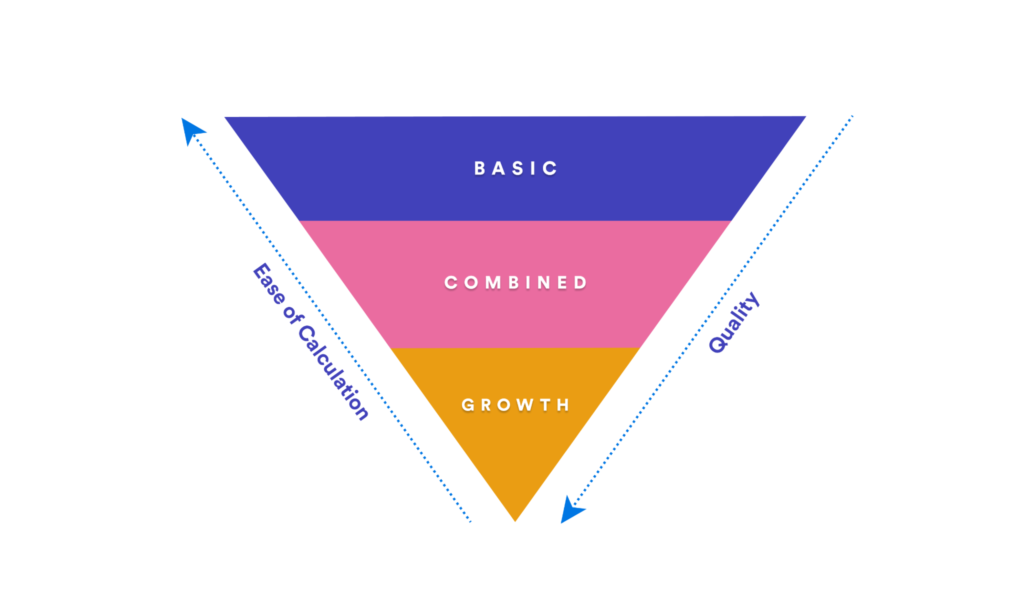
The question is not if marketing teams are and should be using KPIs to measure their performance, rather which ones you are using and are they the most valuable for your business? Before we dive into the individual KPIs, we want to set the foundation for the “KPI – Value Levels”. One might argue that these are “Levels of Complexity”, but we best just clarify what we mean by splitting these KPIs in three levels, in which we will do a deep dive into some of the most critical KPIs.
Basic KPIs
KPIs that are tracked and measured automatically within a specific tool. These KPIs help you get an understanding of how well your performance is developing over time. Most of these KPIs are relatively standardized; they are widely used and, in many cases, serve as the foundation for more advanced KPIs. Some of these KPIs are Website Impressions, Social Media Followers, or Email Subscribers. Within the Basic KPIs, some need a little bit of customization and tweaking to make them relevant for your company. A good example would be the addition of a conversion or a conversion value to your website. By adding these, you can see see how well your visitors perform on your website and which ones are converting.
Some of the essential Basic KPIs are:
1. Website Visitors and Sessions per Source
2. Pages per Session / Dwell Time / Avg. Session Duration
3. Landing Page Conversion Rates
4. Retention Rate
5. % of Data Available: Cookie Consent
Some others are Conversion Value or % of Logged-in users.
Combined KPIs
KPIs that are calculated based on data from multiple tools. Taking your data out of the tools and bringing these data sets together to measure Combined KPIs. Some of the more common ways such KPIs can be measured, is via a Conversion linker or a Pixel. This approach enables a tool to collect data which is collected outside its platform. Such as an advertising conversion that happens on your website.
However, the connection between tools is not always that easy, and you might be forced to export data out of a tool and combine your data into a different place. Most marketers out there probably have a special memory of combining data from various tools in a Spreadsheet to calculate an important value. An example of such a KPI could be the calculation of Return on Ad Spend (ROAS – profit/advertising costs). ROAS requires data from different tools, such as Revenue and Profit Margin data from your Sales tools which then have to be combined with the advertising costs you have across all your platforms.
Some of the most important Combined KPIs are:
6. Leads, Marketing Qualified Lead (MQL), Sales Qualified Lead (SQL)
7. Traffic-to-lead / MQL-to-SQL ratio / Lead-to-customer ratio
8. Customer Acquisition Cost
Some others are Marketing Cost/Touchpoints per Sale, and First interaction to Sale.
Growth KPIs
This is the highest level of quality when it comes to KPIs, and this enables you to add and adjust variables to see which impact a specific variable has on your KPI. Here you can think of combining customer data with your marketing data, enabling you to understand the lifetime value of your customers (CLV). Or adding weather data into your sales data to understand the impact of weather on your product sales.
Using Growth KPIs (level 3) brings you to a level where you can start playing around with variables, in order to understand their impact and make more data-driven marketing decisions – a level where your Marketing team invests into measurable user value, rather than “just spending money.”
Some of the most important Growth KPIs are:
9. Customer Lifetime Value
10. Cost per Lead / Cost per Sale (MQL, SQL)
Now we set the foundations, it’s time to get our hands dirty by diving into some of the most critical KPIs. We have created a shortlist of the ten most crucial online marketing metrics that we recommend every B2B SaaS business should have on its plate.
1. Website Visitors and Sessions per Source
What:
Certainly an obvious KPI and one that can be tracked effortlessly via you website’s connection to Google Analytics: A visitor is a user who has visited your website at least once during the period under consideration. You can measure the number of users who access your website via all marketing sources, determine the proportion of new and returning visitors, and keep an eye on significant fluctuations.
Note: A single visitor can be responsible for multiple sessions as well as for multiple visits (e.g. he visits your site on consecutive days). So keep in mind which one of the two you are using as a KPI.
Why:
The actual number of users is a key KPI to assess the effectiveness of your marketing activities in attracting people to visit your website. By splitting between marketing sources, you can also gain insight into the efficacy of the different channels in driving traffic and determine where your target audience is likely to be active and what their interests are. The attractiveness of individual campaigns and specific topics can also be evaluated based on the number of visits to specific landing pages or articles, allowing appropriate measures and optimizations to be taken.
Note: Due to GDPR and the limitations it brings to the way how tracking works, and how “complete” your data might be, you might want to check this KPI for data accuracy.
How:
Getting to these KPIs does not require a lot of effort as long as you measure website performance using a connection to Google Analytics or similar tracking products. Visitors are among the default reported metrics here.
Where:
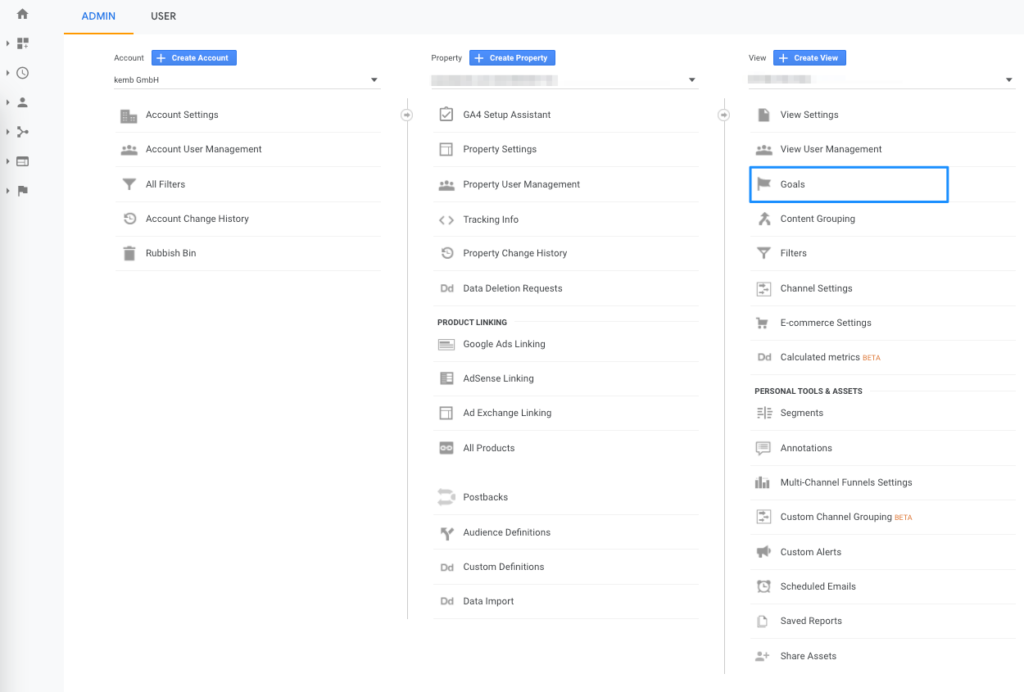
In your Google Analytics account, you will find the number of visitors within the acquisition section. Here you can make further data splits between sources, landing pages and so on, and you can, of course, choose the period you would like to analyze the user data for.
2. Pages per Session / Dwell Time / Avg. Session Duration
What:
How many pages do users access in a session? For how long do they remain on your site after clicking on a search result before returning to the SERPs or taking another action on your site? And lastly, how much time on average do they spend browsing your website before exiting (or being inactive for some time)? Measure this data and gain insight into your website visitors’ behavior.
Why:
The number of users allows measuring your website’s acquisition qualities. However, to gain a more accurate picture of your website’s engagement potential, you can use a set of metrics that measure on-site behaviors. Is your website’s content appealing? Is it arousing the users’ curiosity? How effectively is it keeping users on your website? And do they actually interact with the content.
As a general rule, if your articles are worth reading, users will spend more time on them. If your content is meaningfully interlinked, it will positively affect the number of pages accessed. A strong and convincing overall experience on the website can also increase the average time spent on the site. You should however always bear in mind your individual targets and never examine the numbers in isolation.
A large number of visited pages does not automatically indicate a positive signal. Poor website structuring might sometimes explain users spending a long time looking for the results they wanted.
How:
Again, for these metrics, the question of how basically doesn’t arise. No calculations or connecting data sources are required, as long as you consider the corresponding data for your website only. Therefore, the integration with an analytics tool is sufficient.
Where:
You will find these metrics in the same acquisition section overview which you are using to analyze user numbers.

3. Landing Page Conversion Rates
What:
The percentage of users who have taken a pre-defined and targeted action while visiting your website. It may be that a lead is generated, for instance by completing a contact form, or a purchase is made. Therefore, when looking at the conversion rate, it is therefore essential to always focus on your primary conversion goal.
Why:
The most crucial objective behind a landing page is to convert users. The effectiveness of your landing pages is reflected in the conversion rate. Conversion rate serves as an essential indicator that allows connecting previously mentioned metrics to the ultimate achievement of your primary business goals.
No matter the number of people you attract to your landing page, unless a certain proportion eventually reaches your desired target, e.g., buying your product, your marketing fails to reach its intended business goals. So identify well-functioning landing pages and potential pain points, and then optimize them methodically and systematically. Are call-to-actions correctly displayed, do they use the right colors, and communicate content that encourages action? Do the headlines speak to your audience and is the content neatly structured? Thoroughly test your landing pages and increase the number of users reaching your intended goal.
How:
You can also easily gain insight into your conversion rates in your daily tracking. The metric is also available in your account’s acquisition area. What is rather important in this case is the “preliminary work,” i.e., your definition of target goals, which can of course look quite different depending on the page from signing up for a newsletter or making an appointment to buying a product. Simply set and add targets in the account settings.
Where:
Within the acquisitions section of your Google Analytics account, you can review your website’s global conversion rates or conduct customized analyses. For instance, to get the specific conversion rate of a particular page for organic visitors only, start by selecting the primary dimension „Organic” in the channel selection and then choose “Landing Pages” as a secondary dimension to get a detailed breakdown of all landing pages and corresponding conversion rates for organic traffic.
4. Retention Rate
What:
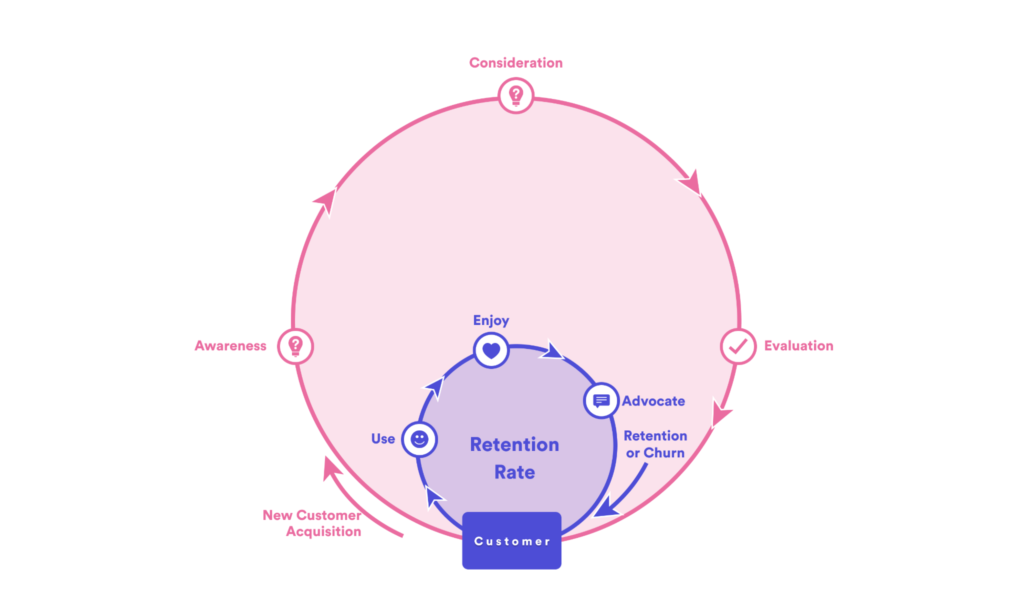
The retention rate indicates which part of your clients are remaining active customers after a certain period. For instance, a year after downloading your app, how many of them are still using it? Or how many people are purchasing a product in your store again or using your service again? The appropriate length of this period and when to define a customer as being active is something each company needs to determine individually. A good remaining quota’s value also varies with the industry and should follow corresponding industry benchmarks.
Why:
Unless your business model is primarily driven by one-time purchases, but instead thrives from ongoing customer engagement, the retention rate is an essential marketing KPI. Moreover, it provides a suitable indication as to how satisfied customers are with your product and how successful you are at developing loyal clients.
As a predictive metric, it allows assessments of growth trends and potential future revenue. It is also relevant concerning marketing efficiency. Generating revenue with loyal customers is typically significantly more cost-effective than acquiring new ones, while customer profitability tends to increase over time as well. To carry out a more in-depth analysis on the efficiency of particular marketing campaigns, keep a constant eye on cohort retention rates. If one cohort is particularly successful, it may result from an excellent remarketing strategy or intensified efforts on a particular marketing channel.
Needless to say, there are shortcomings in the retention rate as a KPI, since it only provides information on active current customers. It does not consider new and reactivated customers, which may skew the overall assessment of your marketing effectiveness.
How:
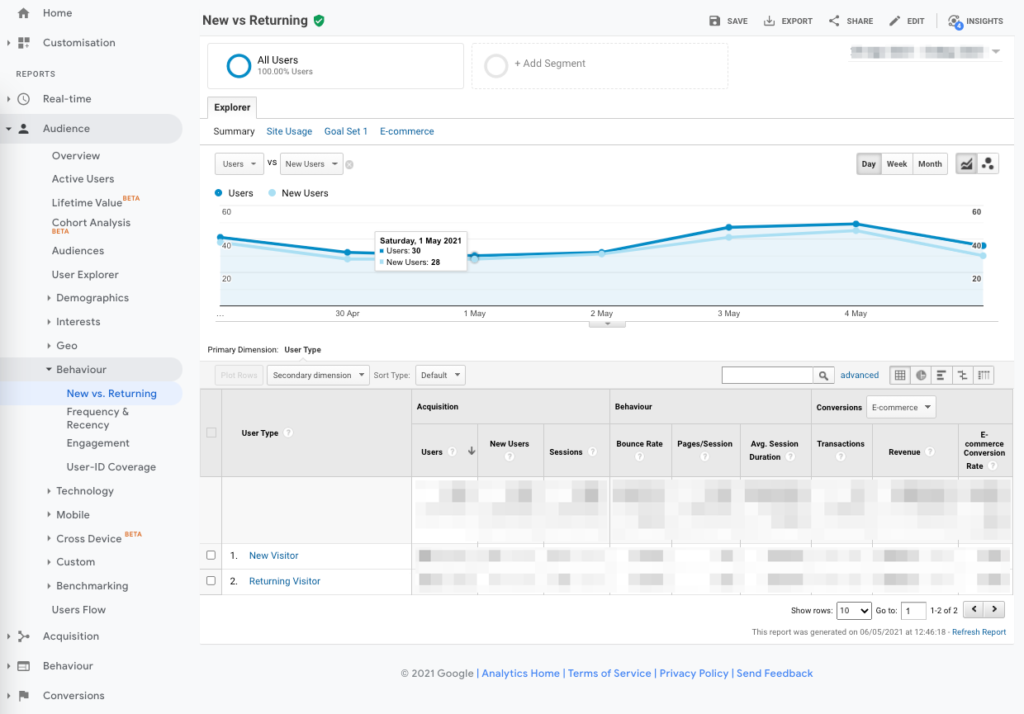
Reviewing visitor retention doesn’t require a lot of effort. The metric flows automatically into your Google Analytics report (select “Audience View,” then go for “Behavior” and choose “New and Returning”). However, in this case, the focus is on actual customers rather than website visitors alone. Calculating the retention rate is simple, based on the underlying time frame and your definition of what an active customer is.
Suppose you want to measure the retention rate for a period of 12 months. Take, for example, 500 active customers at present, 80 of whom have become new customers within the last 12 months. A year ago, you had 450 active customers. So the formula for calculating your retention rate is:
How to Calculate the Retention Rate:
Retention Rate = ((Active Customers Today) – (New Customers)) / (Active Customers 12 months ago) x 100
Thus, for our example:
((500-80)/450) x 100 = 93.3% retention
Again, the value of forming cohorts, e.g., new customer cohorts, should be pointed out in this context, as they allow for a gradual analysis and a targeted examination of individual customer groups.
Where:
Since the active customer status is defined on an individual basis, the corresponding customer data required for calculation should be available in the central CRM system. As mentioned above, the key question is deciding what customers to define as active.
5. Percentage of Data Available: Cookie Consent
What:
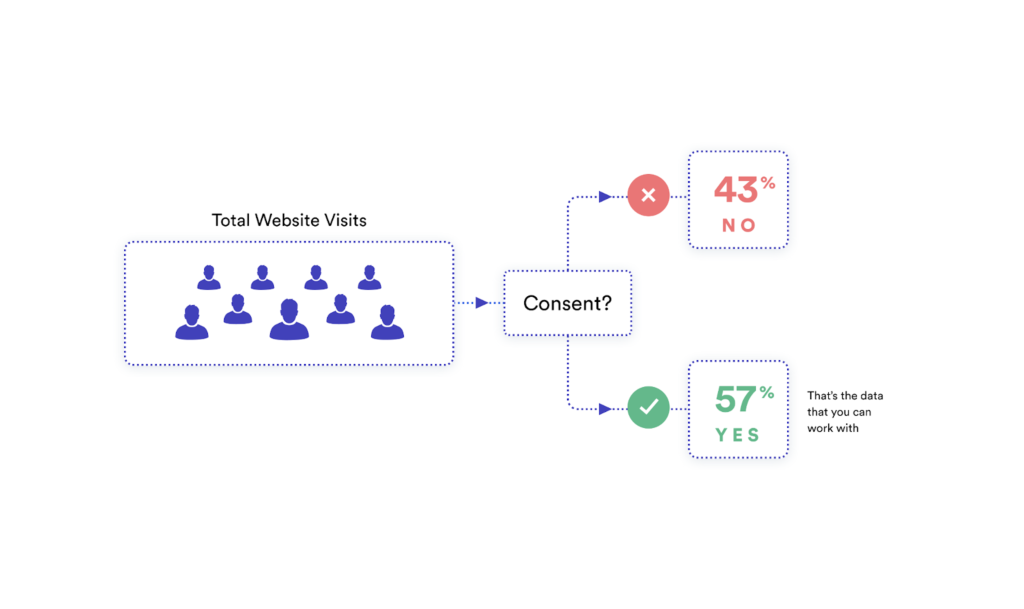
It may come as a surprise to see this KPI listed here. However, do you actually track the percentage of customer data you have available? How many users do in fact provide the required opt-in consent for tracking? A state-of-the-art marketing strategy is strongly dependent on the customers’ behavioral data.
This data drives strategic decision-making for your business. So it is all the more important to know whether you have meaningful data from about 70% of your users, or maybe from only 20%. You therefore want to capture the level of consent and do so as granularly as possible, and enlarge the database through consent optimization.
Why:
Whether to identify problems, optimize conversion rates, or develop your marketing performance, this metric requires the most precise mapping of your marketing funnel possible. Yet, with recent developments in data privacy, both data quantity and quality have significantly diminished. Since the GDPR legislation came into effect in 2018, websites targeting EU citizens must seek users’ active consent before tracking. Tracking consent rates have decreased significantly, with a large portion of user data no longer being collected.
In addition, widely used browsers (Safari, Firefox) have continually extended tracking protection, by blocking first and third-party cookies. Thus, the amount of data available is further reduced. Google, the market leader, will follow suit in the near future. The Chrome browser will also block third-party cookies starting next year. As the number of accessible data decreases and samples decreases, drawing conclusions about your target audience becomes increasingly tricky and deriving appropriate actions more risky.
With this in mind, data-based modeling and predictive analytics will become all the more relevant for future marketing efforts. Additionally, be sure to elevate the consent rate for tracking on your website. Provide transparency of information in order to make users feel informed, conduct A/B tests on consent banners, and implement UX optimizations: Raise consent rates and thus both quantity and quality of your database.
How:
Presuming that you use pop-up banners to gain consent for tracking, you could easily calculate the consent rate on this basis. And, of course, in accordance with data privacy laws, while not already collecting any user data. You could implement a user-independent tracking solution, for instance by hosting the banner yourself, measure the number of hits on your server and then compare those with the hits measured in your performance tracking to get to a ratio.
Where:
The where depends on which option you choose to utilize. Whether this is through a proprietary server, a consent management platform, server-side tracking, or client-side tracking.
6. Leads, Marketing Qualified Lead (MQL), Sales Qualified Lead (SQL)
What:
The definition of each of these intermediate stages until someone becomes a paying customer is not as straightforward, as there is room for interpretation regarding the scope of each. However, the following descriptions can serve you as a guide.
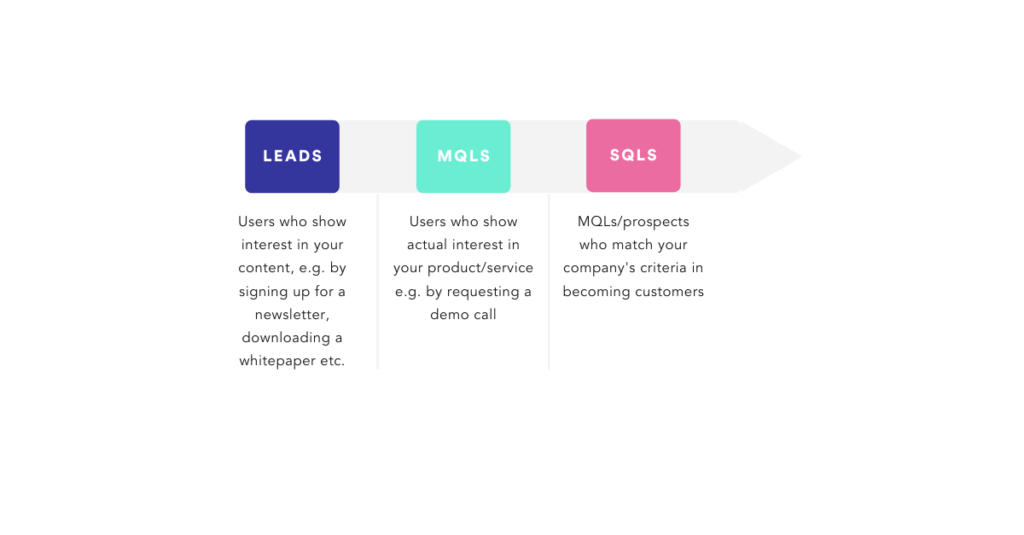
A lead could be someone who signed up for a newsletter or downloaded a content piece that you have curated. This usually lands you his or her email address which then can be used for further nurturing. A certain degree of interest was demonstrated but that does not necessarily mean that the lead would also buy something from your company.
Requesting a demo call or starting a free trial on the other hand exhibits an actual interest in your product or service that qualifies a user as an MQL (Marketing Qualified Lead). At this point, your sales executives usually come into play to determine whether a MQL is also considered a SQL (Sales Qualified Lead), meaning that you evaluate a MQL according to the perceived “fit” to your company. If a SQL is deemed worthwhile, the next steps usually involve trying to convert the SQL into a customer.
Why:
Depending on the business case, it is not always possible to get enough customer acquisition data to adjust your marketing and sales efforts in time. Especially B2B SaaS tend to have longer sales cycles, so in order to bridge this data gap, it is helpful to break down and evaluate the intermediate lifecycle stages. By doing so, you can build an engine that helps you estimate how many leads, MQLs or SQLs are needed to predict the amount of new customers.
How:
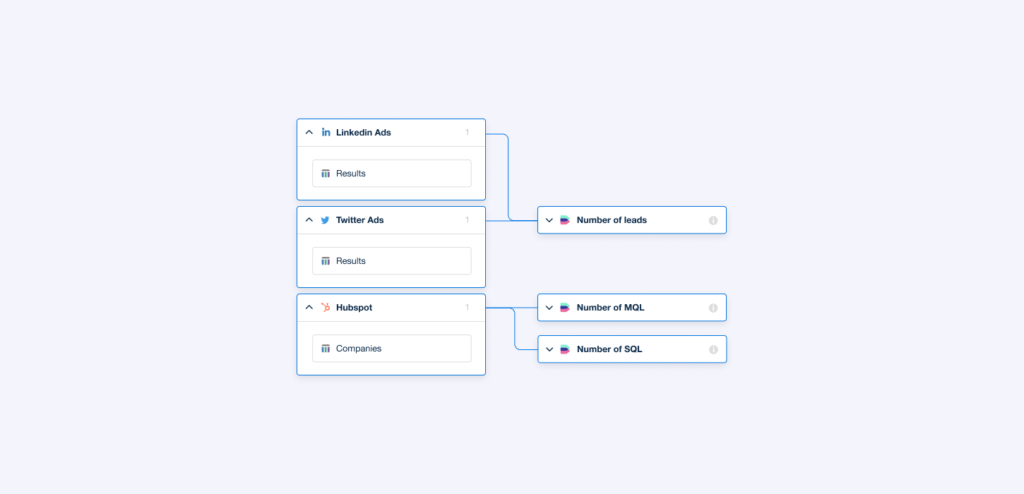
Choose the time frame you want to analyze and the amount of leads will be shown in your tool right away. Within the CRM, you can move contacts into the appropriate stage and get an absolute amount of each MQLs and SQLs displayed.
Where:
If you distribute ads through a marketing platform, the number of leads will be displayed natively, found in e.g. the “results”-column in Twitter Ads. You might also need to connect Google Analytics or Google Sheets to enrich your numbers, especially in cases where leads could only be tracked through a coupon code or UTM tags. MQLs and SQLs require your very own definitions and are therefore often located in a central CRM platform like Hubspot or Zoho.
7. Traffic-to-lead / MQL-to-SQL ratio / Lead-to-customer ratio
What:
You have learnt about the differences between leads, MQLs and SQLs, it is now time to take a closer look at the conversion rates. When thinking of conversion rate, it is most likely associated with the ratio of when prospects become customers like we have explained a few KPIs ago. But there is so much more to it.
The names of the ratios are self explanatory. You look at the rate of conversion from one to another stage.
Why?
The traffic-to-lead ratio shows you the rate of e.g. how many clicks your ad received and how many users ended up downloading your content. Though difficult to say what rate is considered good and what bad as this wildly differs depending on industries, it still is a valuable indicator of your performance. If your traffic-to-lead ratio is much lower compared to industry benchmarks, then you might need to work on your ad copies. Ask yourself why clicks are coming in, but no leads.
MQL-to-SQL ratio is based on the same logic, so if sales don’t deem the incoming MQLs as qualified, are you maybe spending too much time and effort on attracting the wrong audience? Knowing the conversion rates of each intermediate goal can help you navigate your marketing and sales efforts. More MQLs does not necessarily equal more opportunities, especially if you have to allocate your sales resources efficiently.
By pre-occupying sales executives with prospects that have a seemingly lesser fit, you’re not getting to the ones that will actually drive value to your business quick enough. On the other hand, a high amount of supposedly unqualified MQLs could also help you develop your product to unlock untapped potential in the market or re-evaluate your criteria for SQLs.
Catering to lower funnel efforts is most of the time a no brainer, the more interesting question to answer is whether generating leads will pay off in the long run. Lead-to-customer ratio is therefore a highly important metric that should not be overlooked.
How:
Plug in the amount of the stage that is closer to becoming a customer and divide it by the amount of an earlier stage. Be aware to always source the metrics from the same time range though.
How to Calculate Traffic-to-lead:
Traffic-to-lead (%) = (Number of leads) / (Traffic Amount) x (100)
How to Calculate MQL-to-SQL:
MQL-to-SQL (%) = (Number of SQLs) / (Number of MQLs) x (100)
How to Calculate Lead-to-customer:
Lead-to-customer (%) = (Number of customers) / (Number of leads) x (100)
Where:
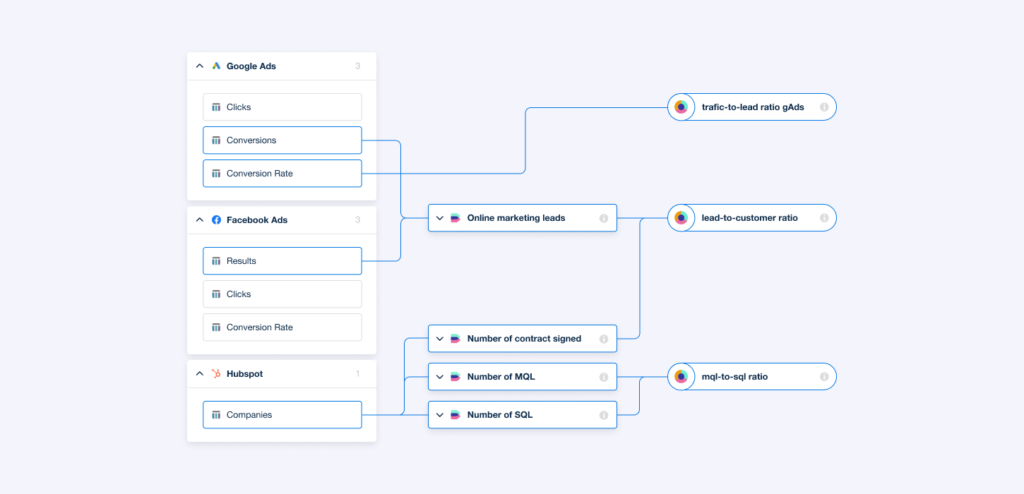
Traffic (often equating clicks in ad campaigns) and leads have to be extracted from each marketing channel, e.g. from Facebook Ads. You also need the number of MQLs and SQLs that are located in a CRM tool like Hubspot. For the Lead-to-Customer ratio, you want to merge all leads across marketing channels and blend the sum with the number of customers that is stored in your CRM, which you can find under “deal stage” in the case of Hubspot.
8. Customer Acquisition Cost
What:
Customer acquisition cost, also known as CAC, is one of the metrics that should be in every Marketer’s repertoire as it tells you how much money was spent to acquire one customer.
Why:
Having covered the KPIs that are often measured in each tool or channel themselves to evaluate the immediate performance, it is also important, if not even more so, to track the numbers that give you a glimpse on the health of your growth. A target-cost per acquisition helps to properly evaluate whether your efforts are sustainable or not.
How:
There is no single right way to compute CAC, as it depends on what output is wanted. You can break down the number of acquisitions on a tool-level to assess the performance of a certain discipline, or combine the sum of new customers across marketing and sales to get an overall KPI. Either way, CAC by itself is inconclusive. CAC of $10 for an e-commerce shop that has an average basket size of $15 is rather weak compared to a CAC of the same amount but for a B2B SaaS business that e.g. provides an HR tool averaging a much higher deal size.
Choose the time range that you wish to analyze, take all costs and divide them by the number of acquired customers.
How to Calculate Customer Acquisition Cost (CAC):
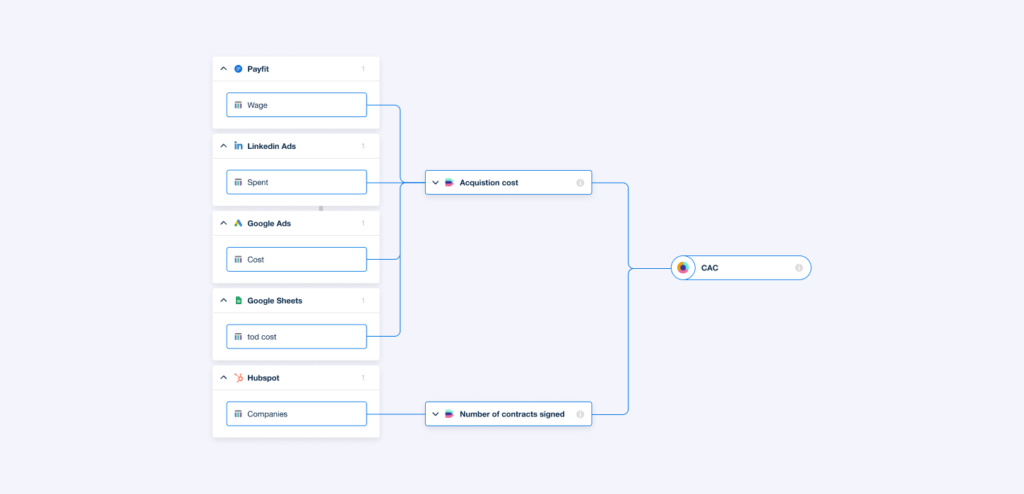
CAC = (Acquisition costs) / (Number of Acquisitions)
Where:
The cost of your marketing and sales teams, ad spend, and all additional expenses that occurred due to the production of materials to support your growth efforts go into CAC. Each of these data points are located in different tools. To get information on salary you need to connect your company’s financials, ad spend have to be sourced from every single marketing channel such as from the “cost”-column in Google Ads, and additional costs are for example all invoices from yet another tool that keeps track of your spendings (e.g. Spendesk). Your CRM gives you the number of acquisitions which are your customers.
9. Customer Lifetime Value
What:
Another important metric is Customer Lifetime Value (or CLV) that helps you understand the profitability of your business.
Why:
By knowing how much profit a single customer will bring in on average throughout the customer lifetime, you can compute the maximum acquisition cost which helps you evaluate your CAC.
How:
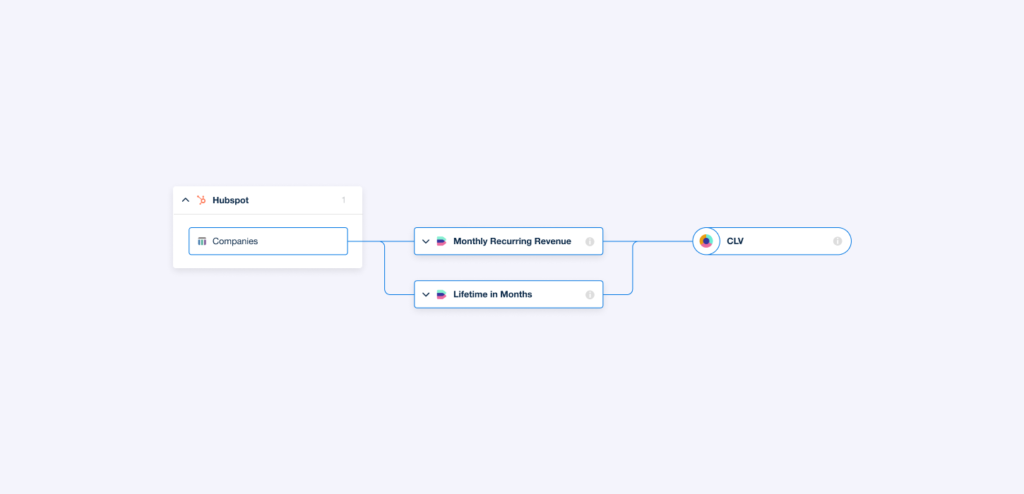
There are several ways to calculate the CLV, we’ll use a SaaS business model as an example. Customers often enter into a contract with the business for a certain amount of time with recurring monthly payments (MRR), plugging in these numbers into the below formula and there you have your CLV.
How to Calculate Customer Lifetime Value (CLV):
CLV = (MRR) x (Lifetime in months)
A more complex example suited for businesses that have smaller payment amounts could be:
Alternative to Calculate Customer Lifetime Value (CLV):
CLV = ((Average Basket Size) x (Repurchase Rate)) x (Lifetime) – (CAC)
This calculation considers the average basket size and repurchase rate to determine the monetary value that a customer will bring in over his or her lifetime with acquisition costs being deducted.
Where:
MRR equals the monthly payments by a client, you can pull this information from your CRM as the amount is specified in “deals” (like in Hubspot). The length of your contract is a good indicator for the customer’s lifetime, which can either be found in your CRM or has to be pulled manually from another platform that stores this kind of contract information.
10. Cost per Lead / Cost per Sale (MQL, SQL)
What:
Cost per lead (or CPL) tells you how much money you had to invest to acquire a lead, usually only accounting for ad spend and not including additional costs as in CAC calculations. The same logic also applies to the other cost per-metrics.
Why?
So why should you bother looking into the average cost of generating a lead, MQL or SQL? Similarly to the aforementioned ratios, tracking these KPIs gives you a trend on your performance. An example that illustrates this use case quite well is the longer sales cycle and lesser availability of data in B2B SaaS businesses. Exploding costs are not immediately apparent if you only look at the cost per sale, but by tracking the average acquisition costs of the other stages as well, you will much faster realize if you’re on the right track or if campaigns or processes along the way need to be fixed.
How:
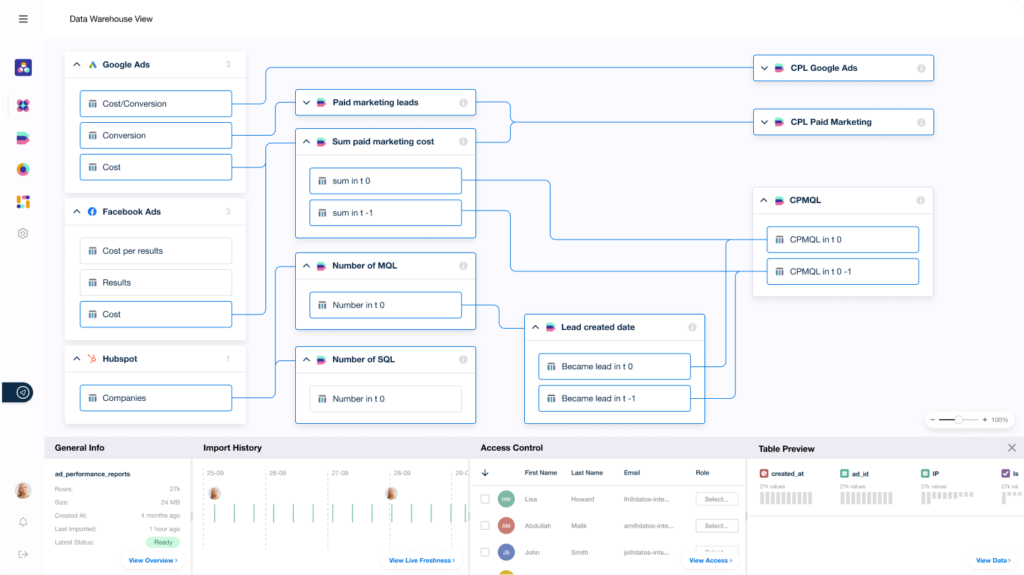
A very one-dimensional approach is to take the ad spend of a specific channel, e.g. Google Ads, and divide it by the number of leads (or sales) from the same time frame. These metrics are often even pre-set as KPIs. But computing an average across channels requires some additional effort as you have to go into each tool, pull the relevant data and then take the sum of all ad spends to divide it by all leads.
How to Calculate Cost per Lead (CPL):
CPL = (Ad Spend) / (Number of Leads)
Looks fairly easy so far but calculating the cost per MQL or SQL is where it gets really tricky. For one, you need to extract even more data sources since the number of MQLs and SQLs are usually stored in a CRM platform. For another, you cannot use the same time range if you want to do marketing attribution correctly. An example to visualize this dilemma: A marketing lead is generated in January, and just turned into a Marketing Qualified Lead in February. If you’re going with a first touch attribution model, it would not make sense to take February’s ad spend to determine the cost per MQL.
There’s always the possibility that some marketing efforts from February had an influence on the conversion to MQL, but what you really want to know is at what date the first touchpoint happened that nudged someone into becoming a lead of yours. In this specific case, you would have to use your ad spend from January as the base of your calculations. Same goes for cost per SQL. Gathering all relevant data from multiple sources can be a pain but is most likely doable if the amount of data is limited. But taking attribution into account is a rather complex task since you have to access and merge data from different periods of time.
Where:
Cost per lead and cost per sale are often to be found in a marketing platform’s native analytics environment such as in LinkedIn Ads, though titled differently as cost per result. If you want to get the perspective across all channels and efforts, you need to integrate all costs spent on campaigns given a certain time frame, e.g. from the “spent”-column in LinkedIn Ads and invoices for cooperations via your spend management platform. The number of MQLs and SQLs are in your CRM tool.
Summary: Smarter Decision making with a high-quality KPI setup
So these were our top picks – regardless if you are fairly new to using KPIs within your marketing or if you have a fully fledged data driven marketing strategy already, the most important take-away we aimed to convey is to always look for ways to improve the quality of your KPIs and how they can help you make smarter decisions. We also hope that we managed to give you some food for thought on how datasets from different platforms can be leveraged in new and innovative ways.
Definitely have a look at the different integrations y42 already offers, let us know if you have any other KPIs that should definitely be on this list and of course let us know via the chat or our contact form, where we can help you with when it comes to your growth challenges.


