How to leverage machine learning in databricks for your forecasts
Forecasting is a critical activity for data-driven decision-making, enabling organizations to predict future trends and outcomes based on historical data. Databricks provides a robust platform for building and deploying forecasting models efficiently.
Table of Contents
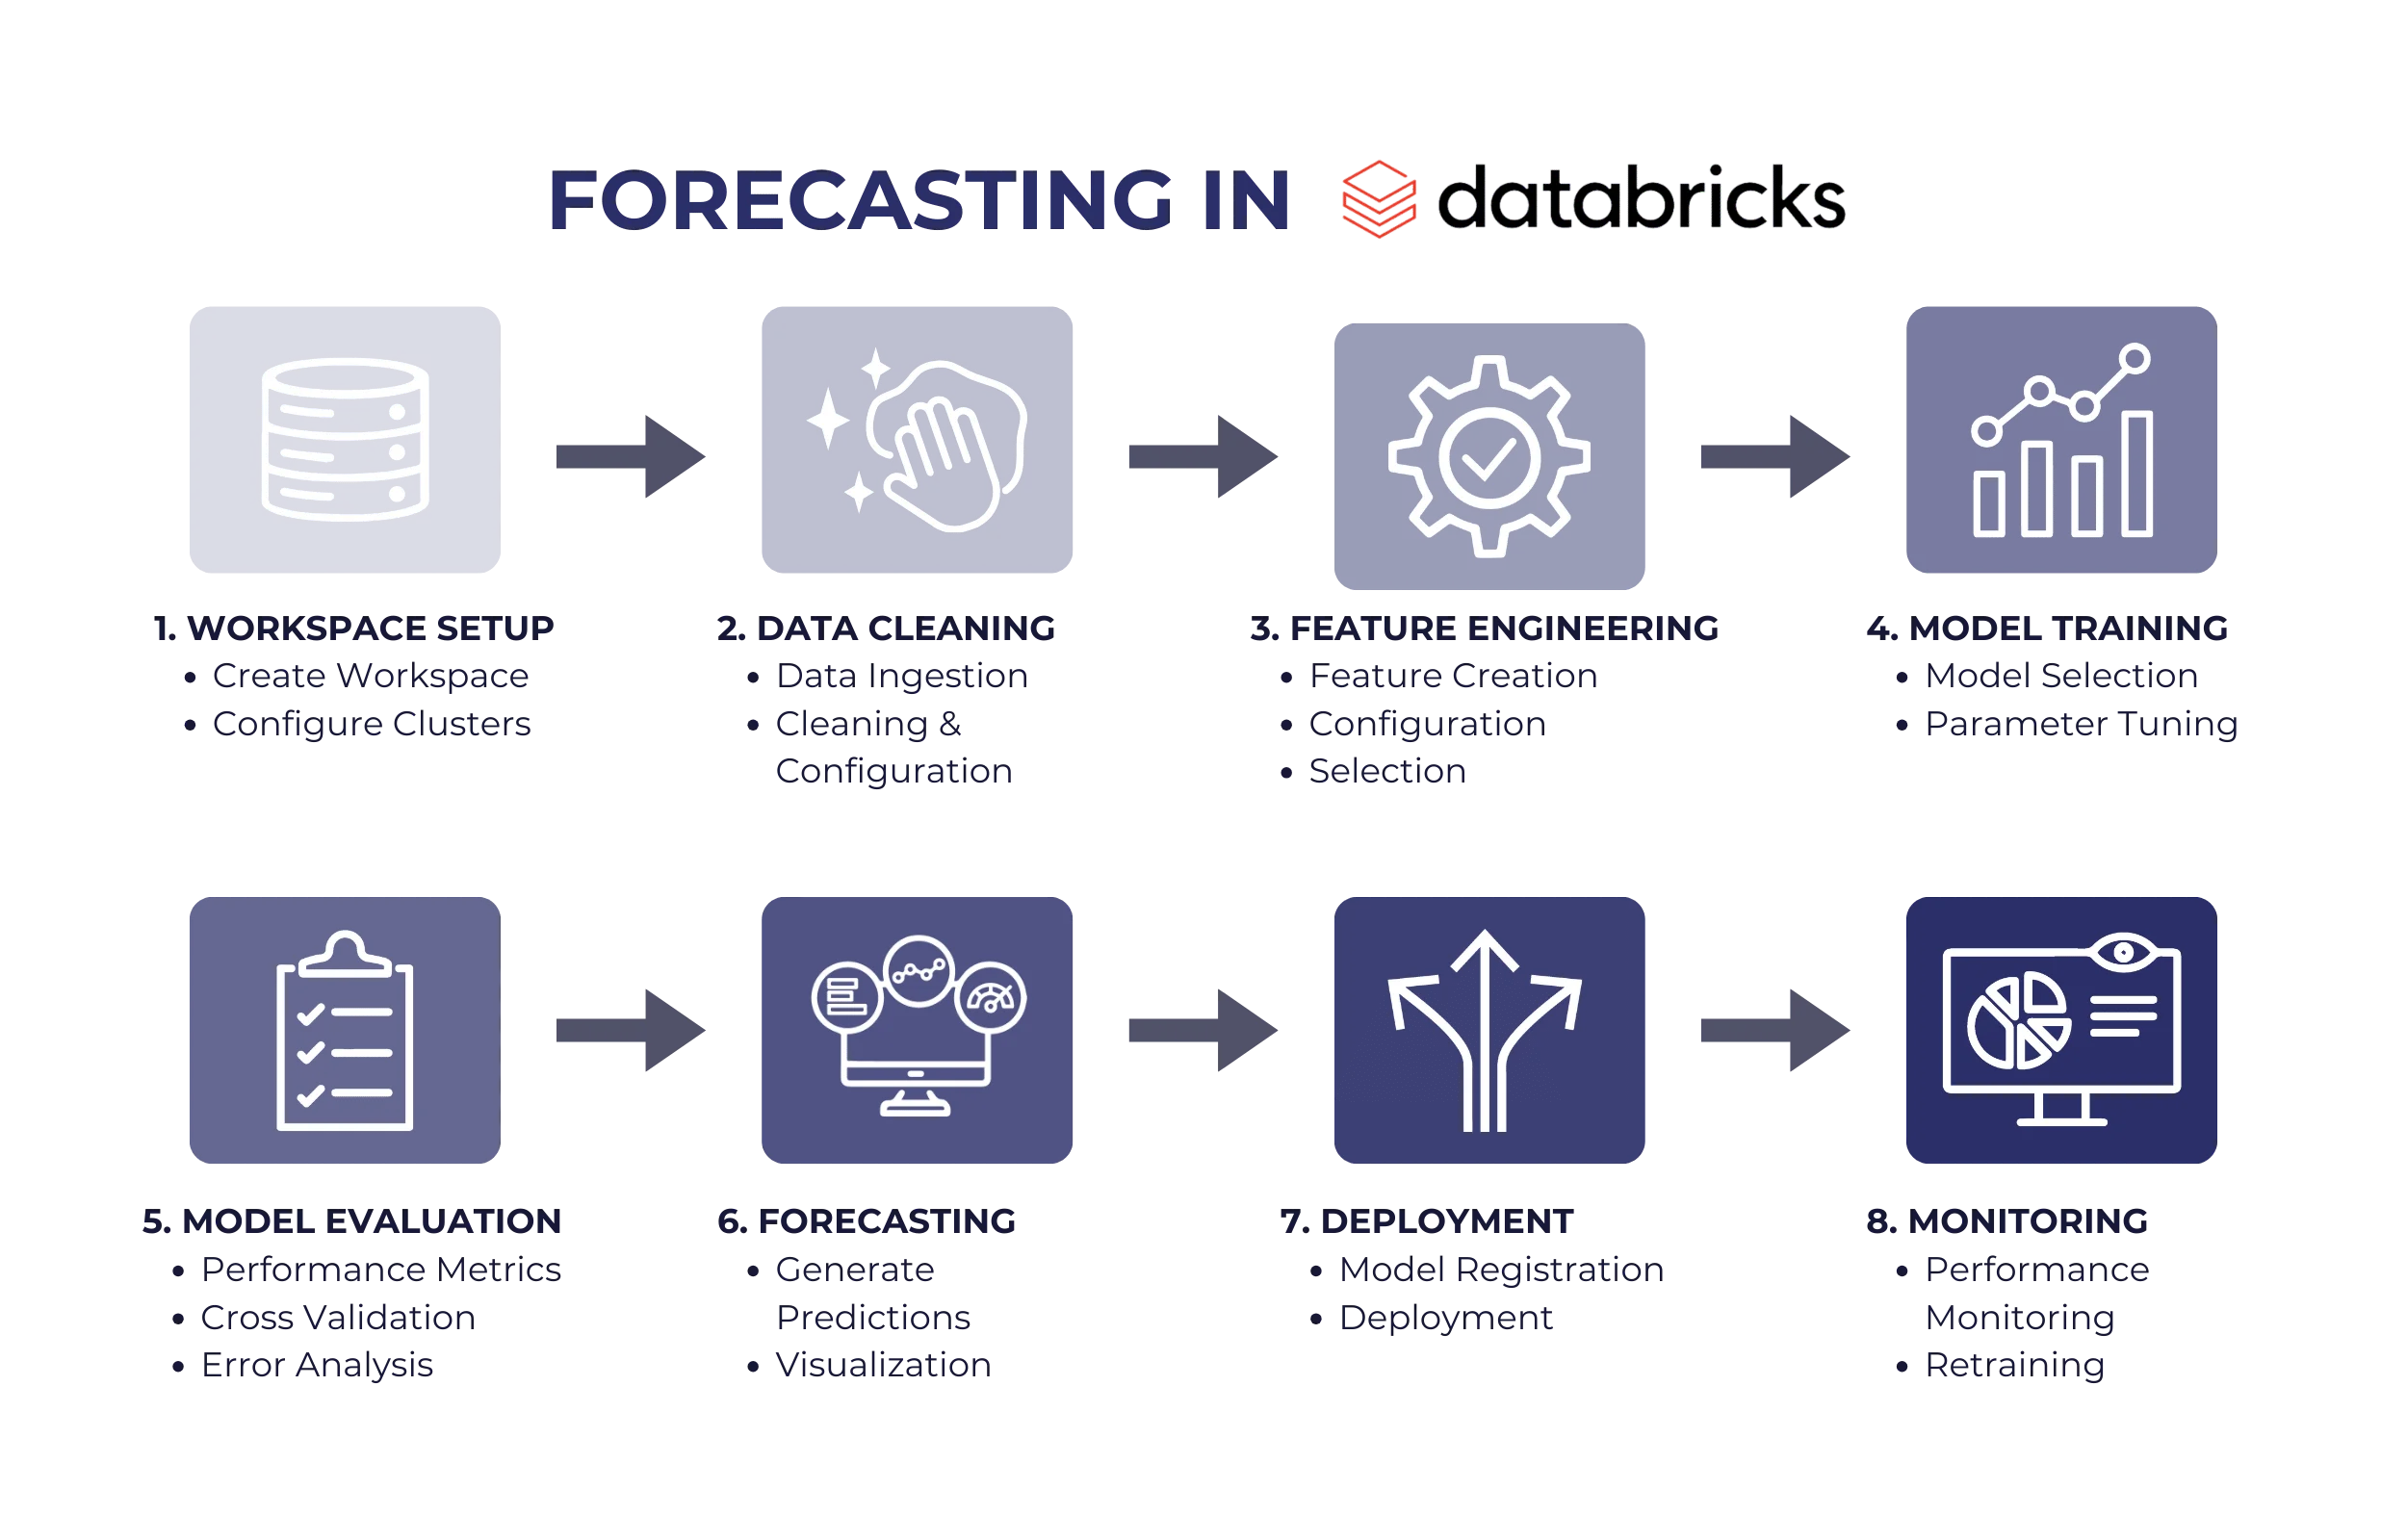
In this guide, we’ll walk you through everything you need to know to set up your Databricks environment for optimal forecasting performance. From preparing your workspace to fine-tuning and monitoring deployed models, you’ll gain practical insights and best practices to ensure your forecasting projects run smoothly and deliver actionable results. Whether you’re just starting or looking to enhance your existing setup, this guide will equip you with the knowledge to make the most of Databricks for forecasting.

1. Set Up Your Databricks Environment
Workspace Creation
The first step in leveraging Databricks is to set up your workspace:
-
Sign In and Setup: Log into the Databricks platform and create your workspace. This workspace acts as your central hub for managing clusters, notebooks, libraries, and other resources.
-
User Permissions: Define access permissions to ensure proper collaboration within your team. Grant roles such as admin, contributor, or viewer to users based on their responsibilities. This promotes security and accountability, ensuring team members have access only to the resources they need.
Cluster Configuration
A cluster is the computational engine that processes your data:
-
Cluster Type: Choose the type based on your needs. Single-node clusters are cost-effective for testing, while multi-node clusters are ideal for large-scale production workloads.
-
Resource Allocation: Configure resources like CPU and memory based on your dataset size and the complexity of your forecasting models. More computationally intensive models, such as deep learning algorithms, require larger clusters.
-
Notebook Attachment: Attach notebooks to clusters to interactively develop, test, and execute scripts, making it easier to iterate and refine your workflows.
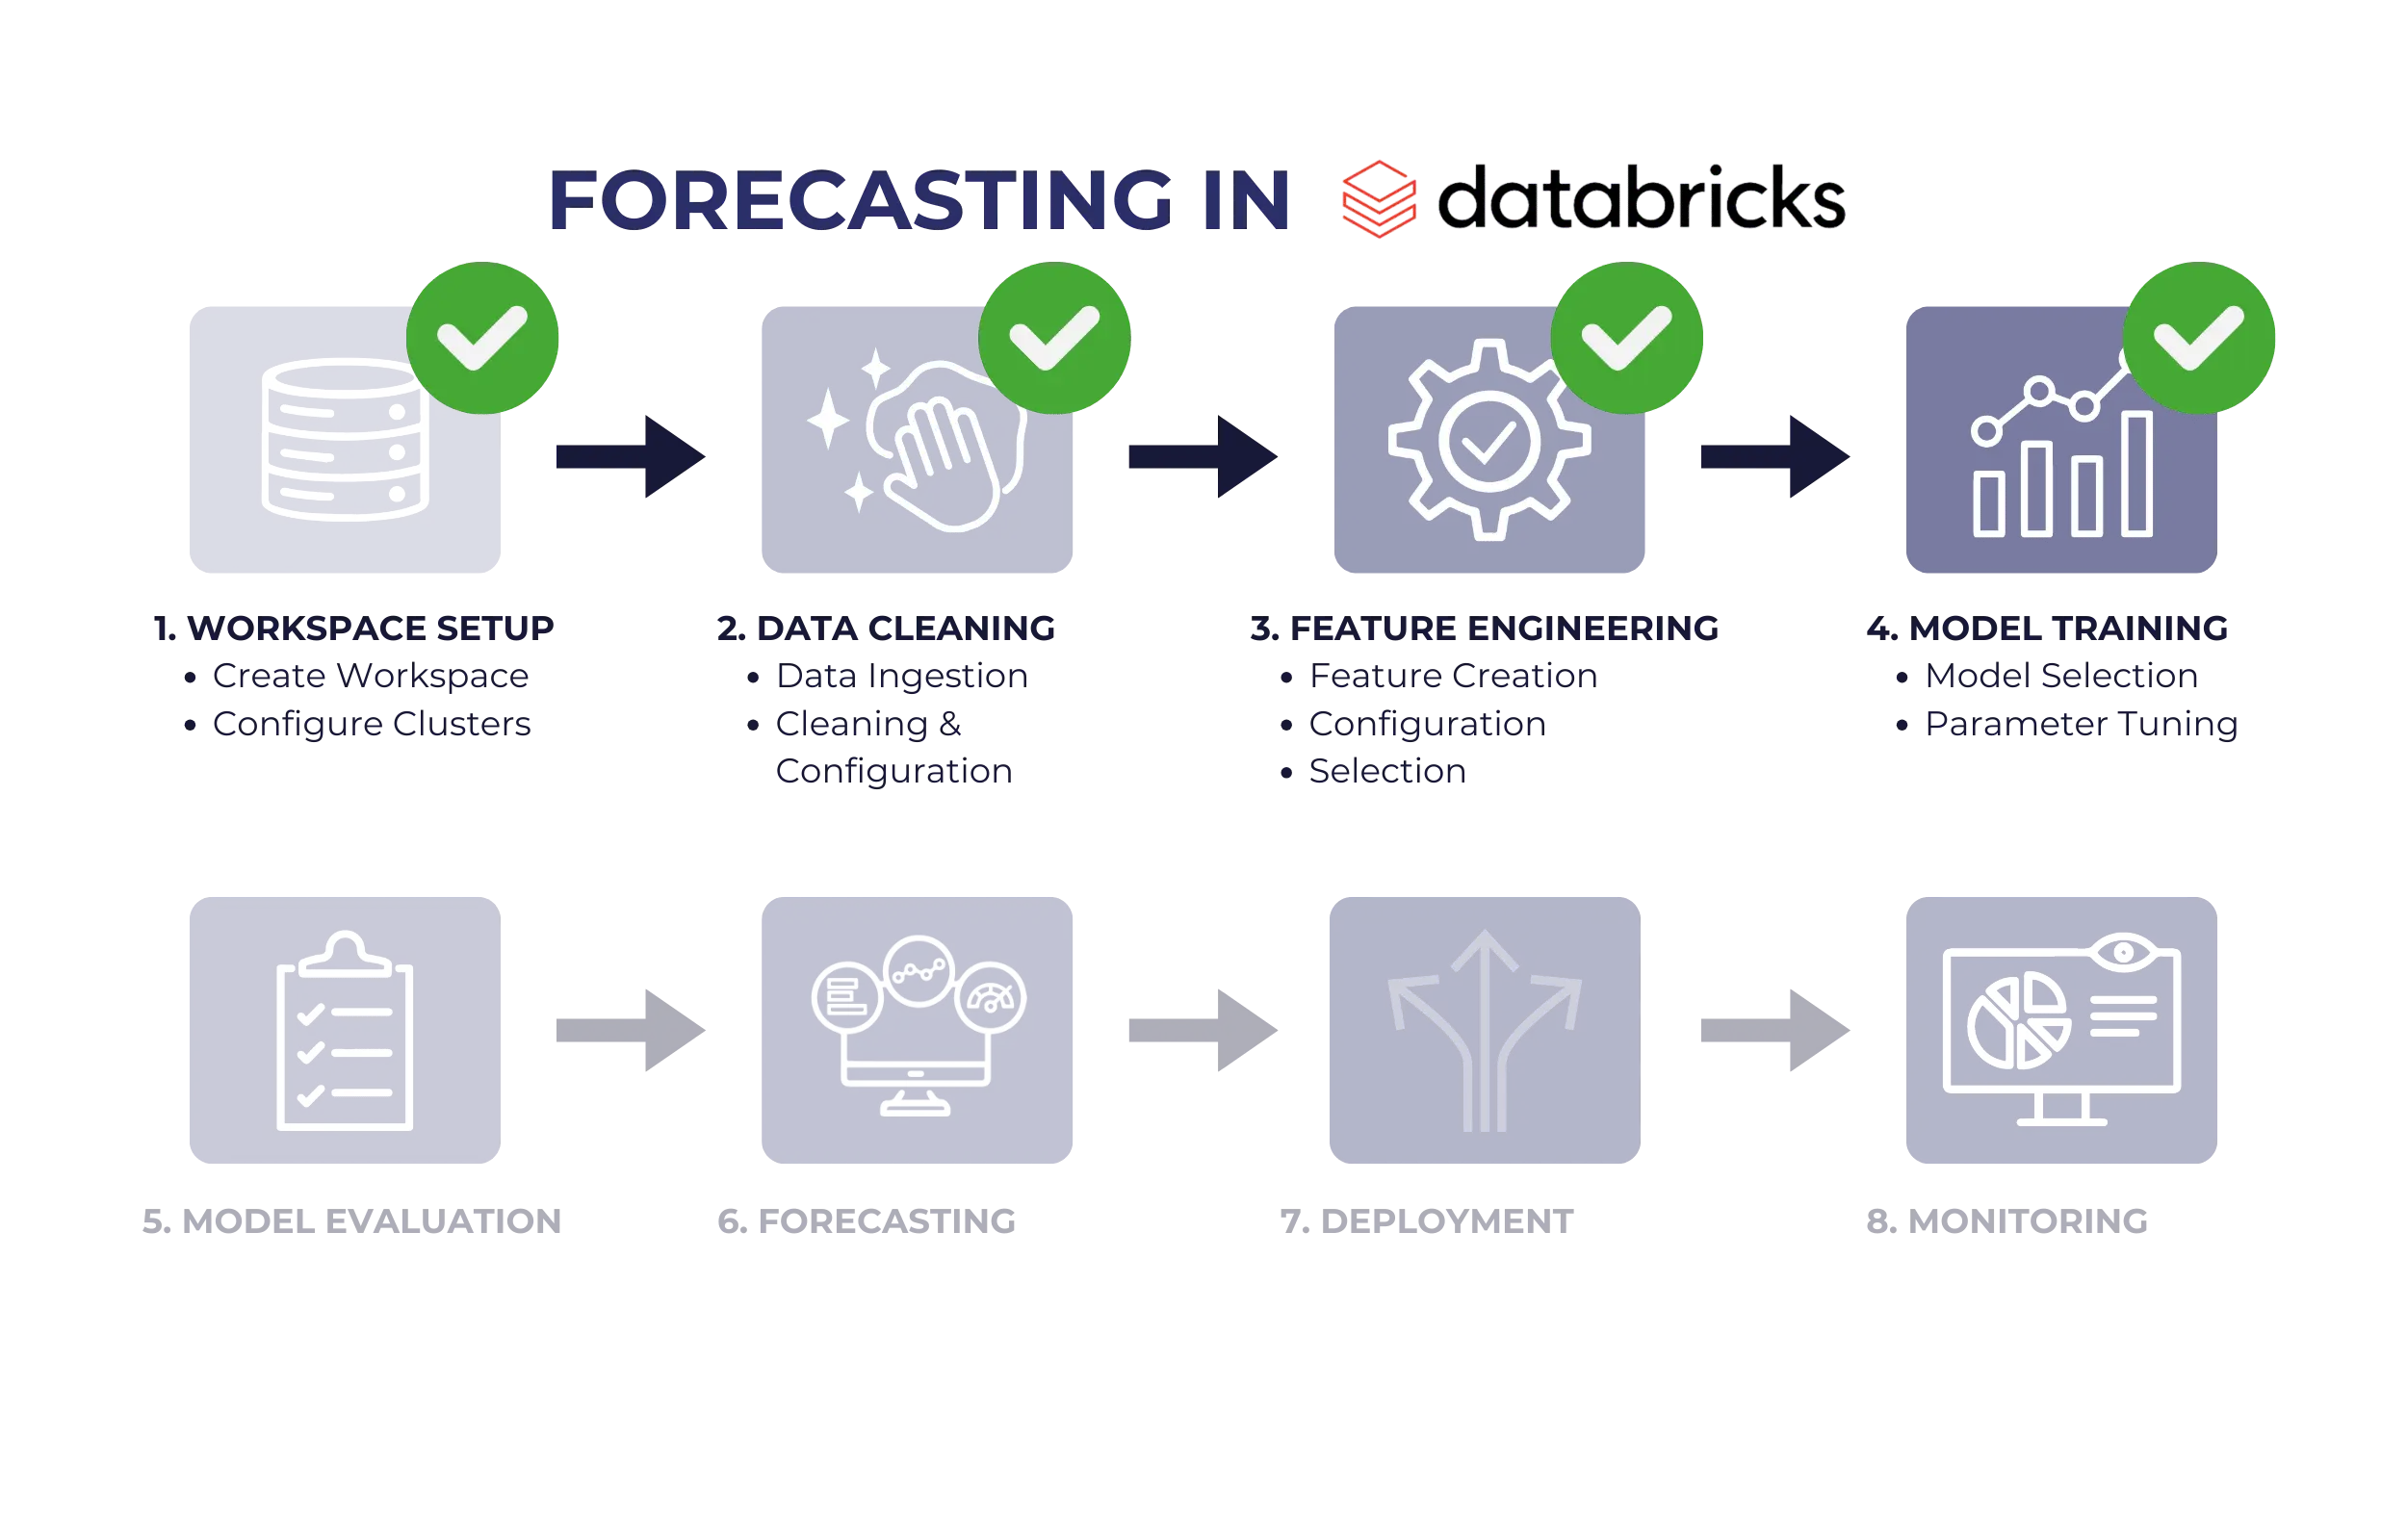
At this stage, you’ve established your workspace and set up clusters for processing. With a secure environment ready for collaboration, you are equipped to begin working with your data. The next step focuses on preparing and organizing your data for forecasting.
2. Data Preparation
Data Ingestion
Gathering and organizing data is the foundation of forecasting:
-
Data Sources: Import data from various formats and locations, such as CSVs, Parquet files, SQL databases, or cloud storage (e.g., AWS S3, Azure Data Lake). Databricks supports connectors for seamless integration.
-
Built-in Tools: Utilize Databricks’ built-in options to upload files or configure direct connections to your data sources.
Data Exploration
Understanding your data helps guide preprocessing steps:
-
Preview Structure: Use SQL queries or Python/PySpark in notebooks to inspect datasets, identifying column types, distributions, and any anomalies.
-
Summary Statistics: Generate metrics like mean, median, standard deviation, and frequency counts to gain a comprehensive understanding of the data.
Data Cleaning
Clean data ensures model accuracy:
-
Handle Missing Values: Address gaps by imputing missing data using mean, median, or mode values, or by removing incomplete records.
-
Standardization: Normalize features to a consistent scale (e.g., using min-max scaling or z-scores) to prevent larger values from disproportionately influencing the model.
-
Consistent Formatting: Ensure fields like dates and times are correctly parsed and stored in appropriate formats (e.g., datetime objects).
By the end of this phase, your data is organized, explored, and cleaned, setting the stage for effective forecasting. Next, you’ll focus on feature engineering to derive meaningful insights from your data.
3. Feature Engineering
Feature Creation
New features can enhance model performance by revealing underlying patterns:
-
Time-based Features: Include indicators such as day of the week, month, seasonality, or holiday flags to capture temporal variations.
-
Domain-specific Features: Calculate relevant aggregates, such as rolling averages or ratios, to provide context specific to the forecasting problem.
Feature Transformation
Refining features improves model interpretability and accuracy:
-
Scaling and Encoding: Normalize numerical features to improve compatibility with machine learning algorithms. Encode categorical features using techniques like one-hot encoding or label encoding.
-
Outlier Handling: Mitigate the impact of outliers through transformations (e.g., log scaling) or capping extreme values.
Feature Selection
Select the most predictive features:
-
Automated Tools: Leverage correlation matrices, variance thresholds, or advanced methods like SHAP (SHapley Additive exPlanations) values to prioritize impactful features.
-
Dimensionality Reduction: Use techniques like Principal Component Analysis (PCA) to eliminate redundant or noisy features.
With this step, you would have crafted and optimized a robust set of features that reveal patterns in your data. Now, you’re ready to train your models to make accurate predictions.
4. Model Training
Model Selection
Choose an algorithm suited to your data:
-
Traditional Models: ARIMA (AutoRegressive Integrated Moving Average) or SARIMA (Seasonal ARIMA) are effective for time series data with identifiable trends and seasonality.
-
Machine Learning Models: Techniques like XGBoost, Random Forest, or Neural Networks are suitable for complex datasets where traditional models may fall short.
Training Process
Divide data into subsets to prevent overfitting:
-
Data Splits: Separate data into training, validation, and test sets. Training sets teach the model, validation sets fine-tune parameters, and test sets evaluate performance.
-
Historical Patterns: Focus on identifying recurring trends, seasonal effects, or anomalies within historical data.
Hyperparameter Tuning
Optimize models for peak performance:
-
Grid Search: Systematically test combinations of parameters to identify the best configuration.
-
Bayesian Optimization: Use probabilistic models to efficiently explore parameter spaces and find optimal settings.
With your model trained and optimized, you have a tool ready to generate predictions. The next step involves evaluating its accuracy and ensuring its reliability.

5. Model Evaluation
Performance Metrics
Quantify model accuracy and reliability:
-
Metrics: Evaluate performance using metrics like Mean Absolute Error (MAE) for average accuracy, Root Mean Squared Error (RMSE) for penalizing larger deviations, and Mean Absolute Percentage Error (MAPE) for relative accuracy.
Cross-Validation
Ensure model robustness:
-
K-Fold Validation: Divide data into k subsets, using each subset as a test set in turn to assess stability and generalization.
Error Analysis
Identify weaknesses in model predictions:
-
Residual Plots: Examine the differences between observed and predicted values to spot systematic errors.
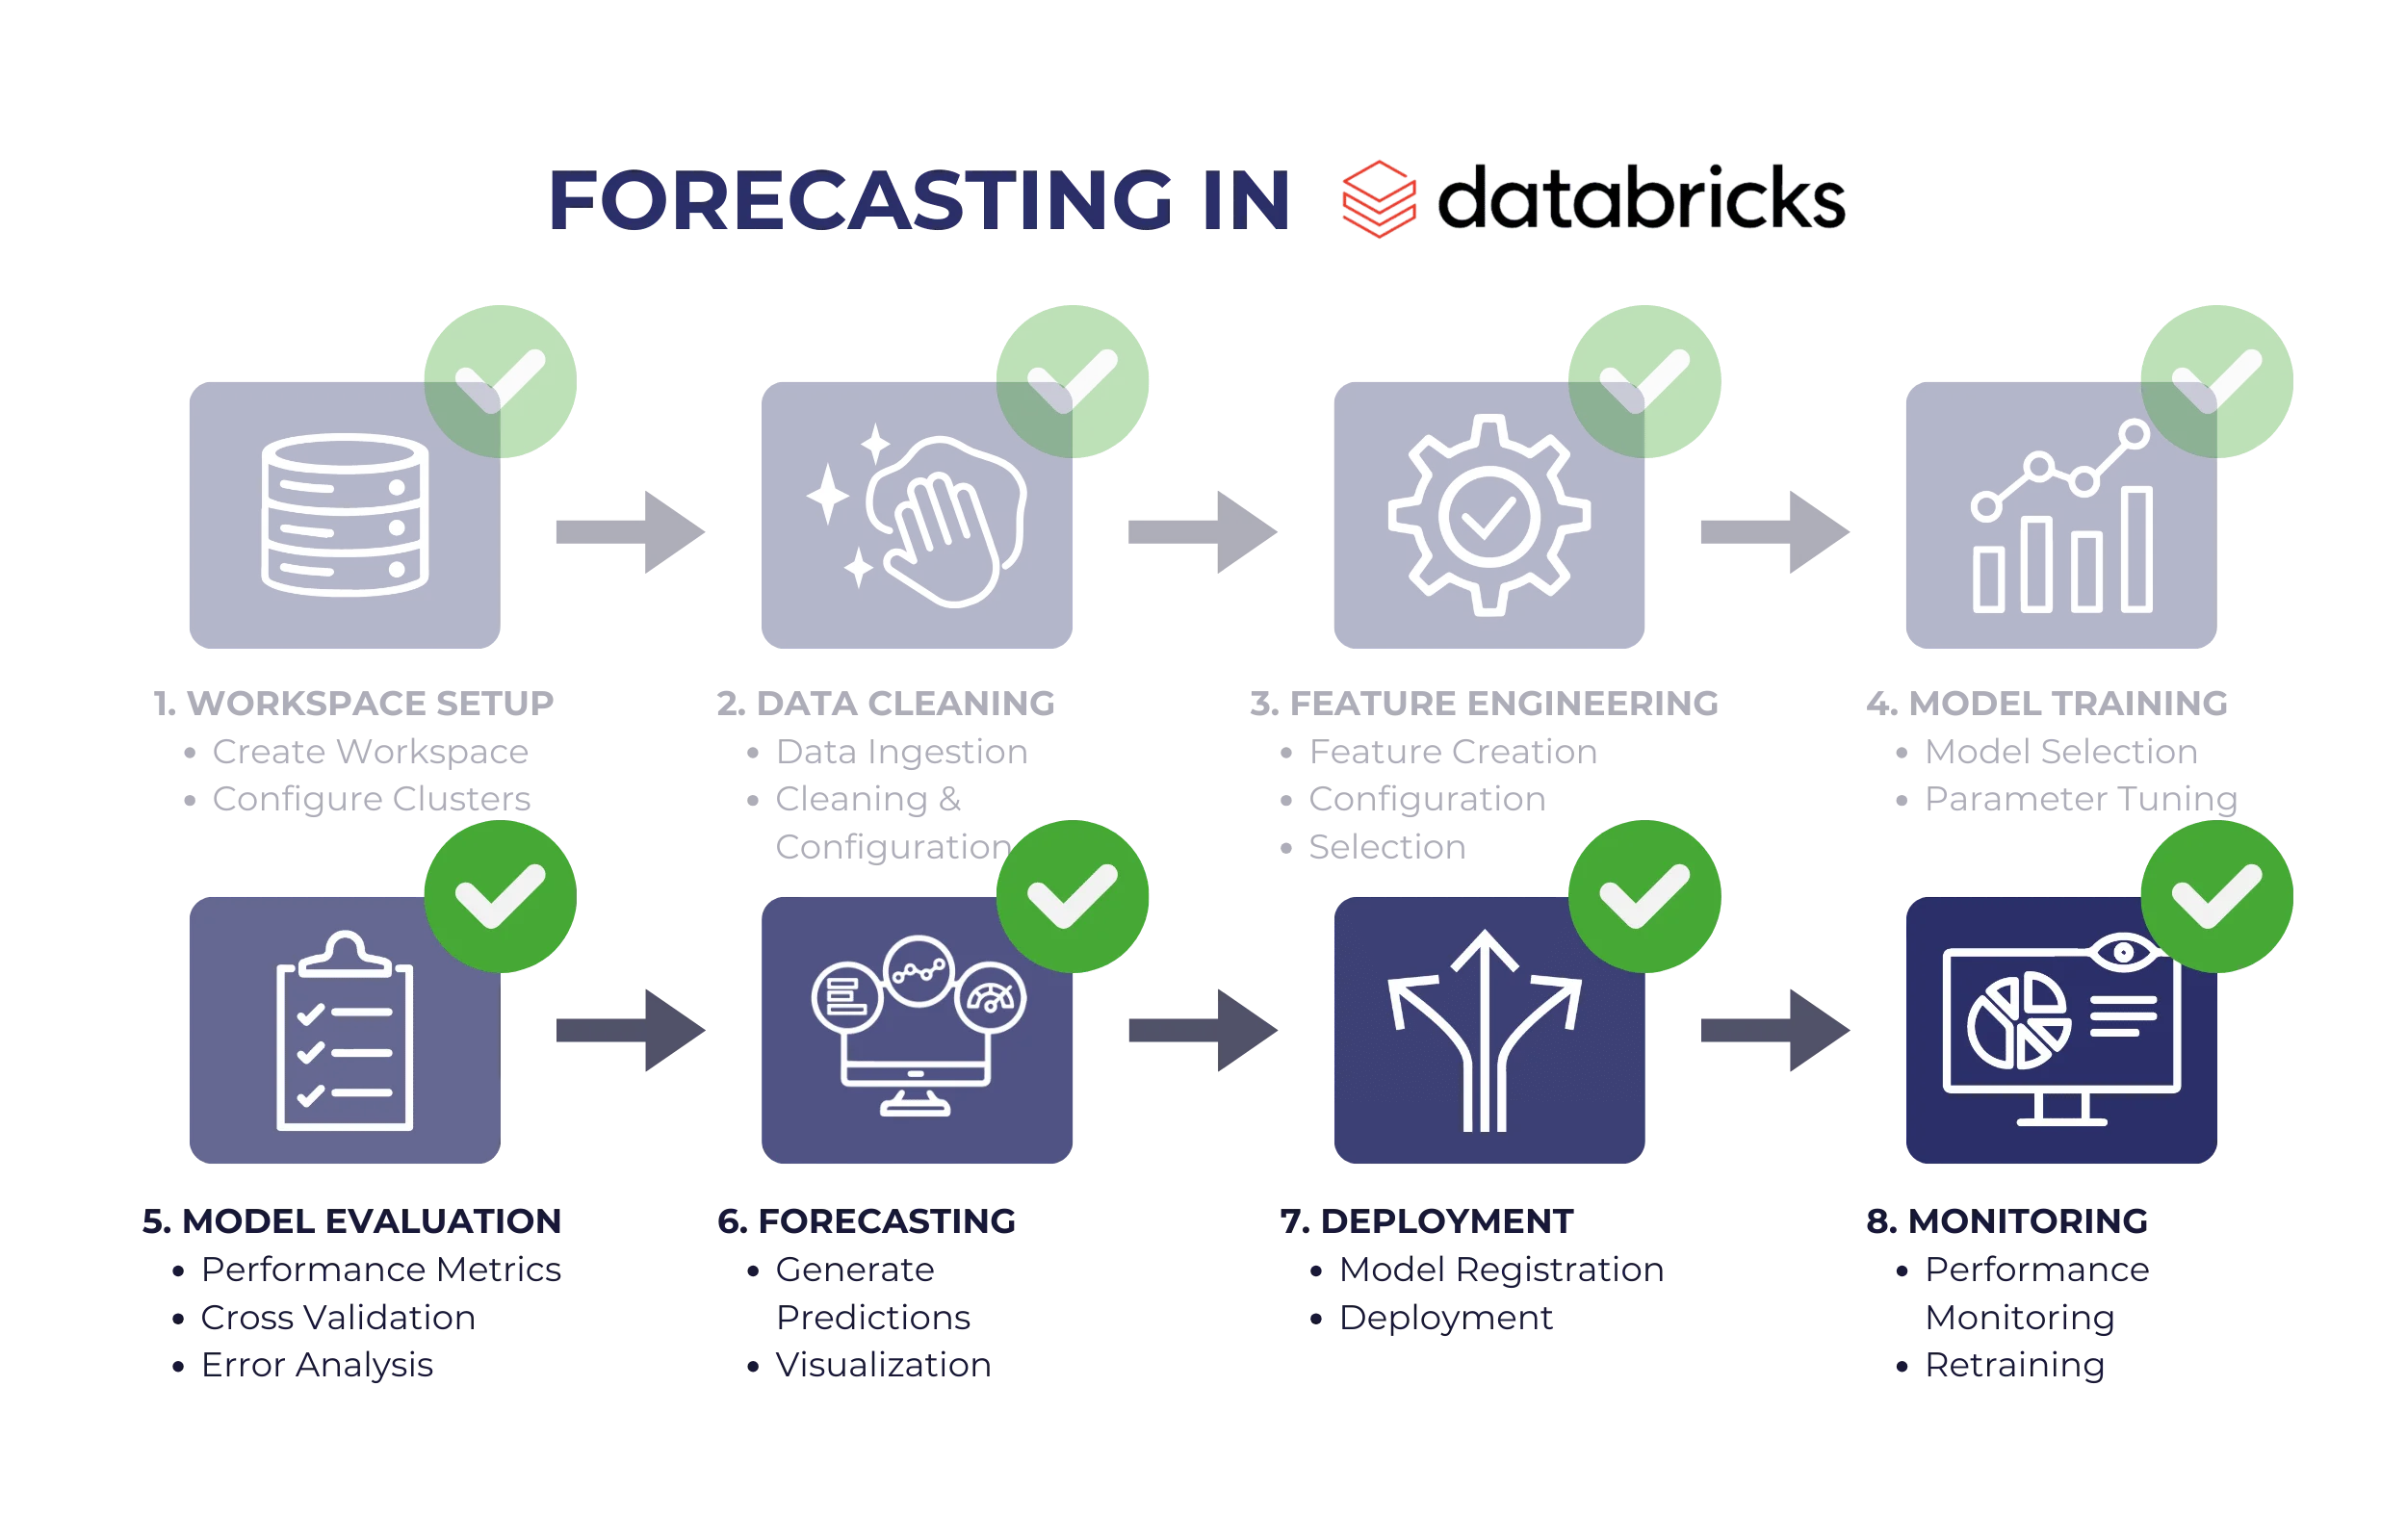
At this point, your model has been rigorously evaluated for accuracy and reliability. Next, you’ll use the trained model to make forecasts and visualize results.
6. Forecasting
Generate Predictions
Use trained models to forecast future values:
-
Future Data: Input unseen datasets to generate predictions for specified time periods.
Scenario Testing
Test hypothetical situations to gauge model behavior:
-
What-If Analysis: Simulate different inputs to understand how changes affect outcomes.
Visualization
Present results effectively:
-
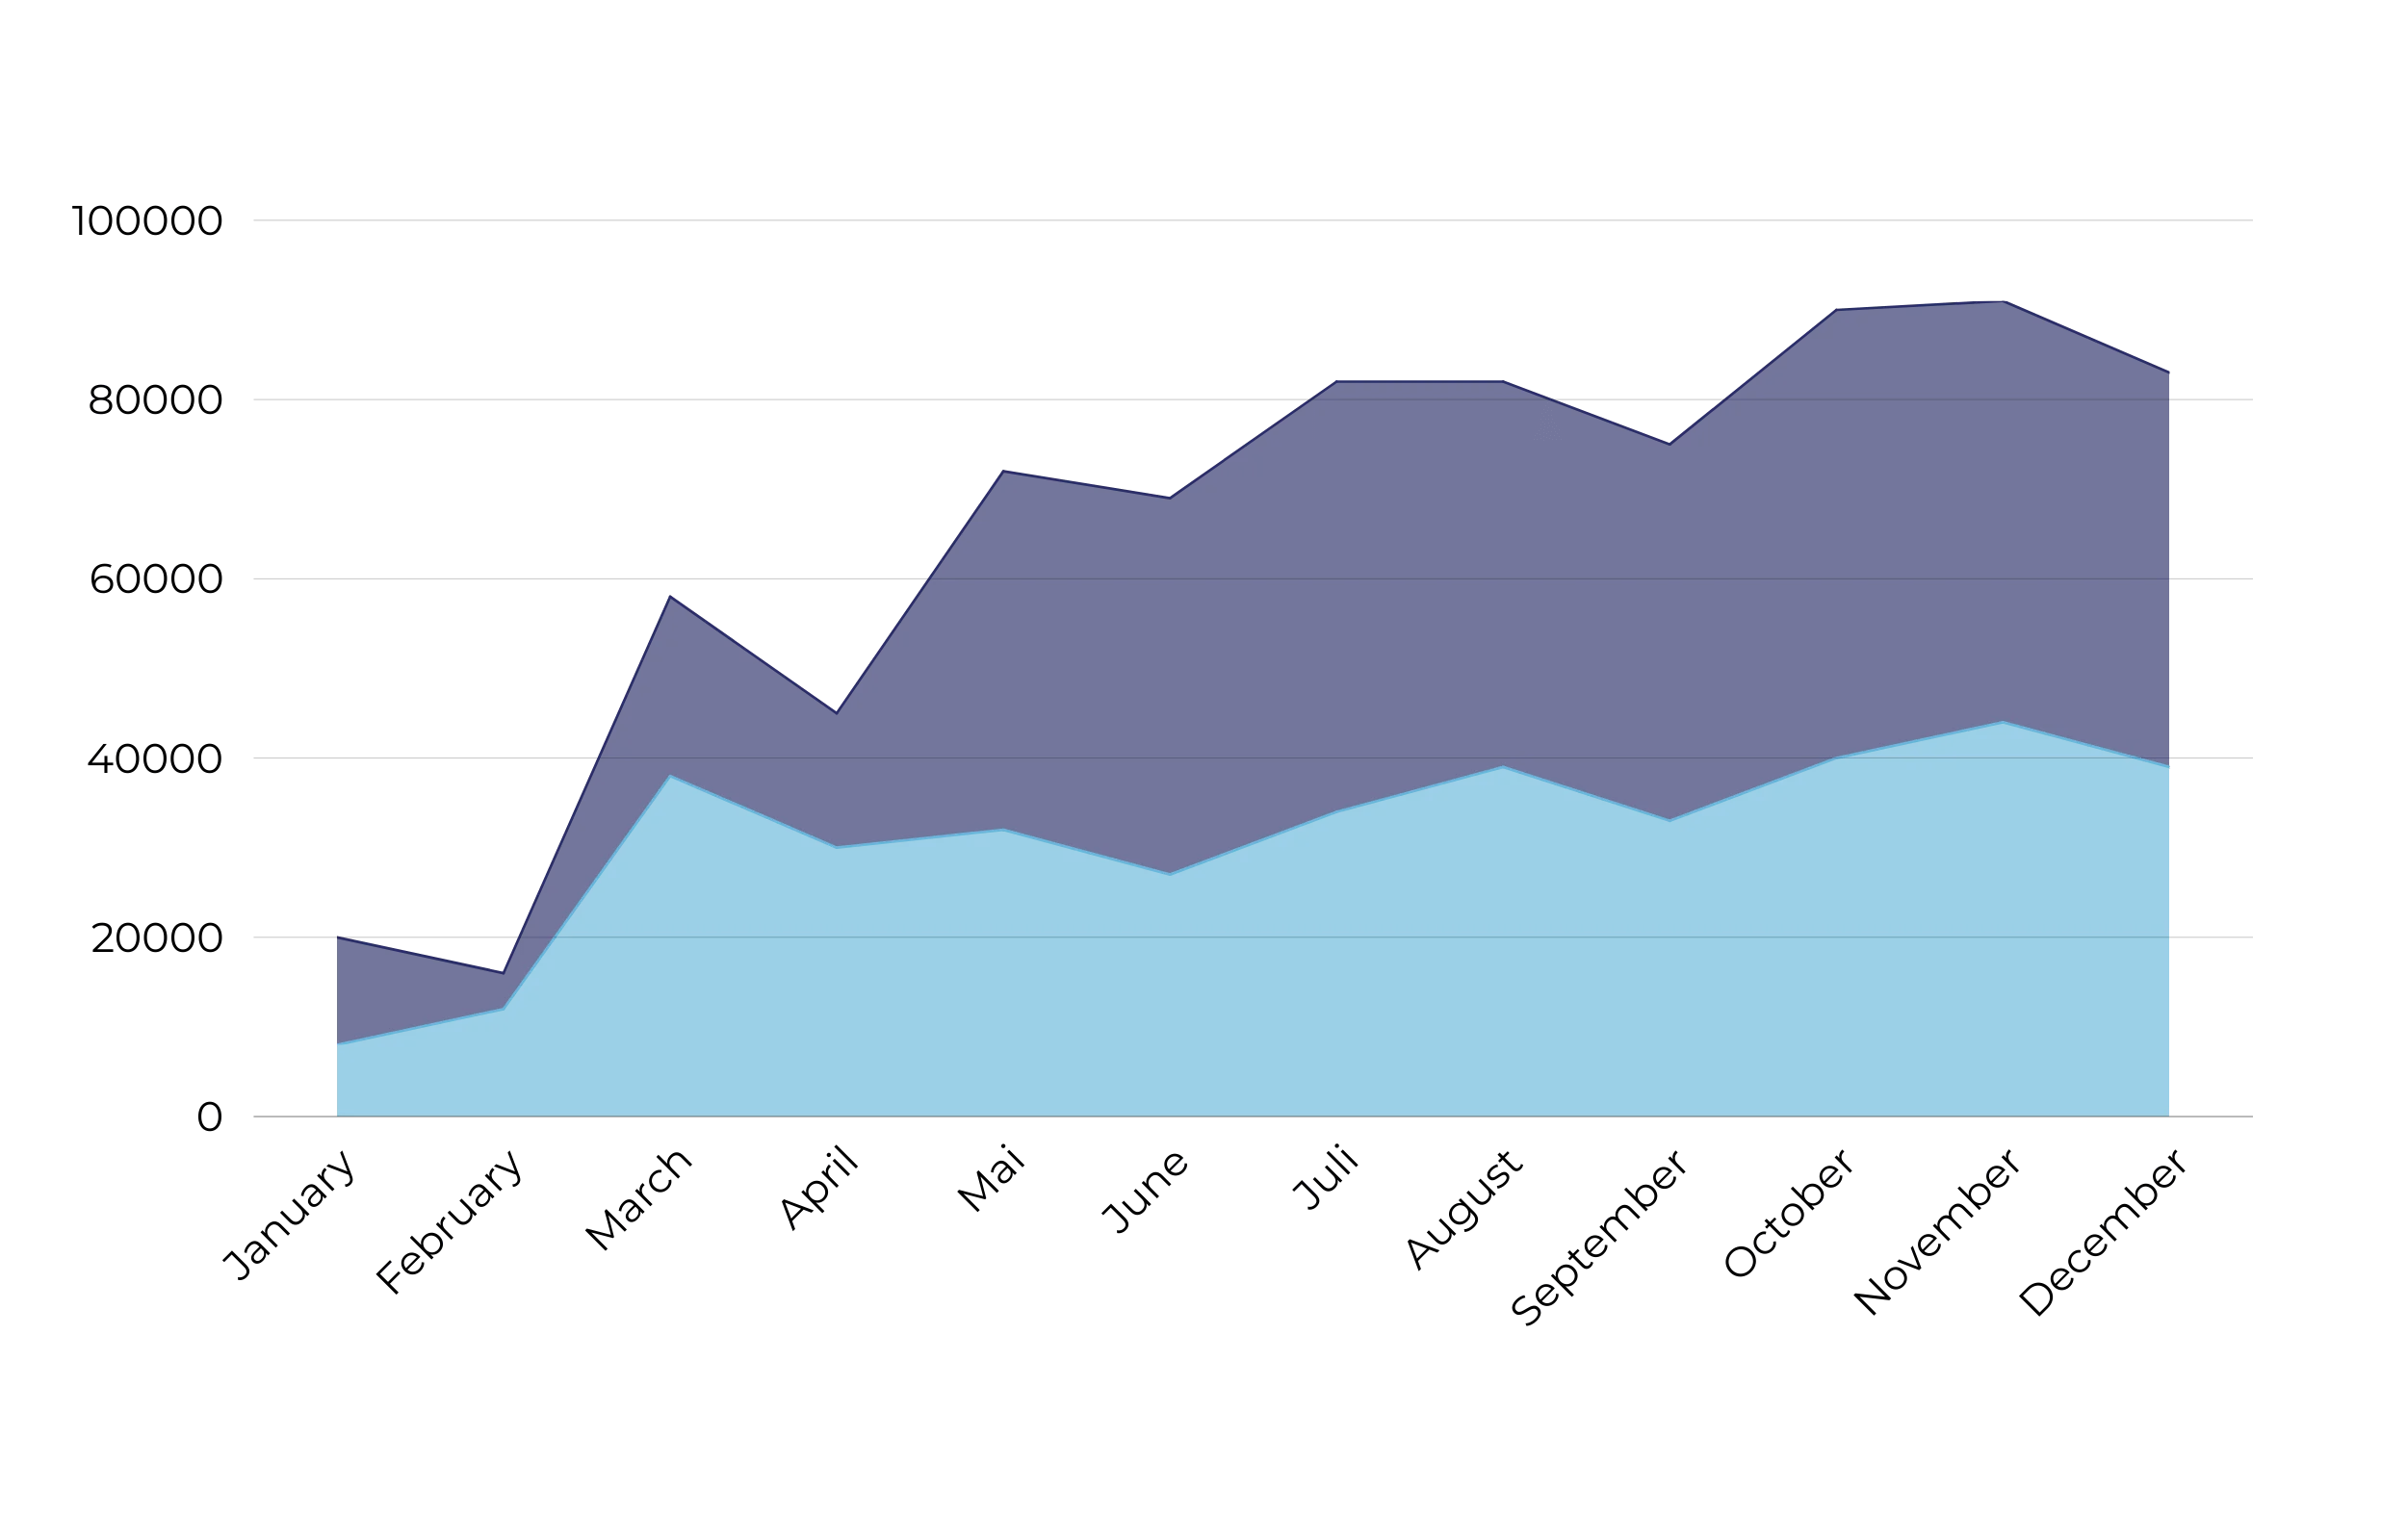
Graphical Outputs: Use line graphs, scatter plots, or heatmaps to visualize predictions, confidence intervals, and trends.
You now have actionable forecasts and clear visualizations to communicate results. The next step is to deploy the model for ongoing use and integration into business processes.
7. Model Deployment
Model Registration
Organize and version models for easy management:
-
Registry: Save trained models along with metadata (e.g., training data, version history, and parameters) in Databricks Model Registry.
Deployment Options
Provide forecasts in formats suited to your use case:
-
Batch Processing: Schedule jobs for periodic updates.
-
Real-Time Serving: Set up APIs for immediate predictions.
Integration
Incorporate predictions into business tools:
-
Dashboards: Connect outputs to visualization tools like Tableau or Power BI to enhance decision-making.
With your model deployed and predictions integrated into workflows, the focus shifts to monitoring and maintaining performance over time.
8. Monitoring and Maintenance
Performance Monitoring
Track and maintain model effectiveness:
-
Key Metrics: Regularly monitor accuracy, data drift (changes in input data), and runtime performance.
Feedback Loops
Refine models with real-world insights:
-
User Feedback: Incorporate input from end-users to align models with actual needs.
Retraining
Keep models relevant:
-
Periodic Updates: Retrain models on fresh data to adapt to evolving trends and conditions.
At this stage, your deployed model is under continuous monitoring and refinement, ensuring it remains accurate and relevant as conditions evolve.

Conclusion – a seamless workflow for your data tasks
Databricks is a powerful platform that simplifies the complexities of modern data engineering, analytics, and forecasting. From setting up your workspace and preparing data to engineering features, training models, and deploying forecasts, it provides a seamless, integrated workflow for handling even the most challenging data tasks. The ability to scale computational power, leverage a wide range of machine learning techniques, and monitor models ensures you stay ahead in an increasingly data-driven world.

As you work through the process, it’s crucial to maintain clean and well-organized data, select the right features, and choose algorithms tailored to your specific use case. Equally important is the need for constant monitoring and retraining to keep your models accurate and relevant. By mastering these aspects, businesses can unlock actionable insights, streamline operations, and make informed decisions.
At KEMB, we specialize in data-driven growth strategies, leveraging platforms like Databricks to help businesses achieve their goals. Whether you’re just starting with Databricks or looking to optimize your existing setup, our team of experts is here to guide you every step of the way. Contact us today to learn how we can help you harness the full potential of Databricks and take your data strategy to the next level. Let’s drive smarter decisions together!

